使用 OpenCV 在Python中实现 Canny 边缘检测器
在本文中,我们将学习由 John F. Canny 在 1986 年开发的流行 Canny 边缘检测算法的工作原理。通常,在 Matlab 和 OpenCV 中,我们将 Canny 边缘检测用于边缘检测中的许多流行任务,例如车道检测、素描,边框去除,现在我们将从头开始学习该算法的内部工作和实现。
理论理解
该算法涉及的基本步骤是:
- 使用高斯滤波器降噪
- 沿横纵轴的梯度计算
- 假边缘的非最大抑制
- 用于分离强边缘和弱边缘的双阈值
- 通过滞后进行边缘跟踪
现在让我们详细了解这些概念:
1. 使用高斯滤波器降噪
这一步在 Canny 边缘检测中至关重要。它使用高斯滤波器从图像中去除噪声,这是因为由于边缘检测器的强度突然变化,这种噪声可以被假定为边缘。高斯核中元素的总和为 1,因此,在对图像应用卷积之前,应该对核进行归一化。在本教程中,我们将使用大小为 5 X 5 和 sigma = 1.4 的内核,这将模糊图像并从中去除噪声。高斯滤波器核的方程是

2.梯度计算
当图像被平滑时,导数 Ix 和 Iy 在 x 和 y 轴上计算。它可以通过使用 Sobel-Feldman 内核卷积与图像来实现,如下所示:
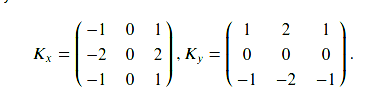
索贝尔内核
在应用这些内核之后,我们可以使用梯度幅度和角度来进一步处理这一步。幅度和角度可以计算为
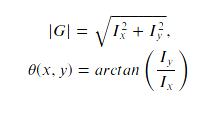
梯度大小和角度
3. 非最大抑制
此步骤旨在减少沿边缘的重复合并像素,使其不均匀。对于每个像素在正负梯度方向上找到两个邻居,假设每个邻居占据pi / 4的角度,0为向右直的方向。如果当前像素的大小大于相邻像素的大小,则没有任何变化,否则,当前像素的大小设置为零。
4. 双阈值
梯度幅度与两个指定的阈值进行比较,第一个低于第二个。小于低阈值的梯度被抑制,高于高阈值的梯度被标记为强梯度,相应的像素被包含在最终的边缘图中。所有剩余的梯度都被标记为弱梯度,与这些梯度相对应的像素在下一步中被考虑。
5. 使用滞后的边缘跟踪
由于由真实边缘引起的弱边缘像素将连接到强边缘像素,因此具有弱梯度的像素 W 被标记为边缘并包含在最终的边缘图中当且仅当它与某个像素 S 涉及相同的连通分量具有强梯度。换句话说,应该有一个连接 W 和 S 的相邻弱像素链(相邻是考虑的一个周围的 8 个像素)。我们将编写并实现一个算法,该算法仅考虑每个像素一次即可找到梯度图的所有连通分量。之后,您可以决定哪些像素将包含在最终的边缘图中。
下面是实现。
Python3
import numpy as np
import os
import cv2
import matplotlib.pyplot as plt


# defining the canny detector function

# here weak_th and strong_th are thresholds for
# double thresholding step
def Canny_detector(img, weak_th = None, strong_th = None):

    # conversion of image to grayscale
    img = cv2.cvtColor(img, cv2.COLOR_BGR2GRAY)

    # Noise reduction step
    img = cv2.GaussianBlur(img, (5, 5), 1.4)

    # Calculating the gradients
    gx = cv2.Sobel(np.float32(img), cv2.CV_64F, 1, 0, 3)
    gy = cv2.Sobel(np.float32(img), cv2.CV_64F, 0, 1, 3)

    # Conversion of Cartesian coordinates to polar
    mag, ang = cv2.cartToPolar(gx, gy, angleInDegrees = True)

    # setting the minimum and maximum thresholds
    # for double thresholding
    mag_max = np.max(mag)
    if not weak_th:weak_th = mag_max * 0.1
    if not strong_th:strong_th = mag_max * 0.5

    # getting the dimensions of the input image
    height, width = img.shape

    # Looping through every pixel of the grayscale
    # image
    for i_x in range(width):
        for i_y in range(height):

            grad_ang = ang[i_y, i_x]
            grad_ang = abs(grad_ang-180) if abs(grad_ang)>180 else abs(grad_ang)

            # selecting the neighbours of the target pixel
            # according to the gradient direction
            # In the x axis direction
            if grad_ang<= 22.5:
                neighb_1_x, neighb_1_y = i_x-1, i_y
                neighb_2_x, neighb_2_y = i_x + 1, i_y

            # top right (diagonal-1) direction
            elif grad_ang>22.5 and grad_ang<=(22.5 + 45):
                neighb_1_x, neighb_1_y = i_x-1, i_y-1
                neighb_2_x, neighb_2_y = i_x + 1, i_y + 1

            # In y-axis direction
            elif grad_ang>(22.5 + 45) and grad_ang<=(22.5 + 90):
                neighb_1_x, neighb_1_y = i_x, i_y-1
                neighb_2_x, neighb_2_y = i_x, i_y + 1

            # top left (diagonal-2) direction
            elif grad_ang>(22.5 + 90) and grad_ang<=(22.5 + 135):
                neighb_1_x, neighb_1_y = i_x-1, i_y + 1
                neighb_2_x, neighb_2_y = i_x + 1, i_y-1

            # Now it restarts the cycle
            elif grad_ang>(22.5 + 135) and grad_ang<=(22.5 + 180):
                neighb_1_x, neighb_1_y = i_x-1, i_y
                neighb_2_x, neighb_2_y = i_x + 1, i_y

            # Non-maximum suppression step
            if width>neighb_1_x>= 0 and height>neighb_1_y>= 0:
                if mag[i_y, i_x]neighb_2_x>= 0 and height>neighb_2_y>= 0:
                if mag[i_y, i_x]grad_mag>= weak_th:
                ids[i_y, i_x]= 1
            else:
                ids[i_y, i_x]= 2


    # finally returning the magnitude of
    # gradients of edges
    return mag

frame = cv2.imread('food.jpeg')

# calling the designed function for
# finding edges
canny_img = Canny_detector(frame)

# Displaying the input and output image
plt.figure()
f, plots = plt.subplots(2, 1)
plots[0].imshow(frame)
plots[1].imshow(canny_img) 
输入图像

输出图像