在 ReactJS 中使用 Recharts 创建双轴折线图
简介: Rechart JS 是一个用于为 React JS 创建图表的库。该库用于在 React 和 D3(数据驱动文档)的帮助下构建折线图、条形图、饼图等。
双轴折线图是一种折线图,它有两个 Y 轴而不是一个。它用于比较具有不同 Y 轴的两个不同系列的数据点。
方法:要使用 recharts 在 react 中创建双轴折线图,我们首先创建一个包含所有数据点和标签的数据变量。然后我们创建一个笛卡尔网格和所有三个轴,即一个 X 轴和两个 Y 轴。此外,将 y-axisId 添加到两个 Y 轴,以便在绘制折线图时可以引用它们。最后,使用 recharts npm 包中的 Line 组件将折线图指向它周围。
创建 React 应用程序和安装模块的语法:
第 1 步:使用以下命令创建一个 React 应用程序。
npx create-react-app foldername第 2 步:创建项目文件夹(即文件夹名称)后,使用以下命令移动到该文件夹。
cd foldername第 3 步:创建 ReactJS 应用程序后,使用以下命令安装所需的模块。
npm install --save recharts项目结构:它将如下所示。

示例 1:现在在 App.js 文件中写下以下代码。在这里,App 是我们编写代码的默认组件。
App.js
import React from 'react';
import { LineChart, Line, XAxis, YAxis, CartesianGrid} from 'recharts';


const App = () => {

// Sample data
const data = [
  {x:1, y:23,  z:122},
  {x:2, y:3,   z:73},
  {x:3, y:15,  z:32},
  {x:4, y:35,  z:23},
  {x:5, y:45,  z:20},
  {x:6, y:25,  z:29},
  {x:7, y:17,  z:61},
  {x:8, y:32,  z:45},
  {x:9, y:43,  z:93},
];


return (


);
}

export default App;
App.js
import React from 'react';
import { LineChart, Line, XAxis, YAxis, CartesianGrid} from 'recharts';


const App = () => {

// Sample data
const data = [
  {x:1, y:123,  z:122},
  {x:2, y:113,   z:713},
  {x:3, y:125,  z:312},
  {x:4, y:235,  z:123},
  {x:5, y:145,  z:420},
  {x:6, y:25,  z:529},
  {x:7, y:117,  z:61},
  {x:8, y:32,  z:435},
  {x:9, y:143,  z:93},
];


return (


);
}

export default App;运行应用程序的步骤:从项目的根目录使用以下命令运行应用程序:
npm start输出:现在打开浏览器并转到
http://localhost:3000/ ,您将看到以下输出:
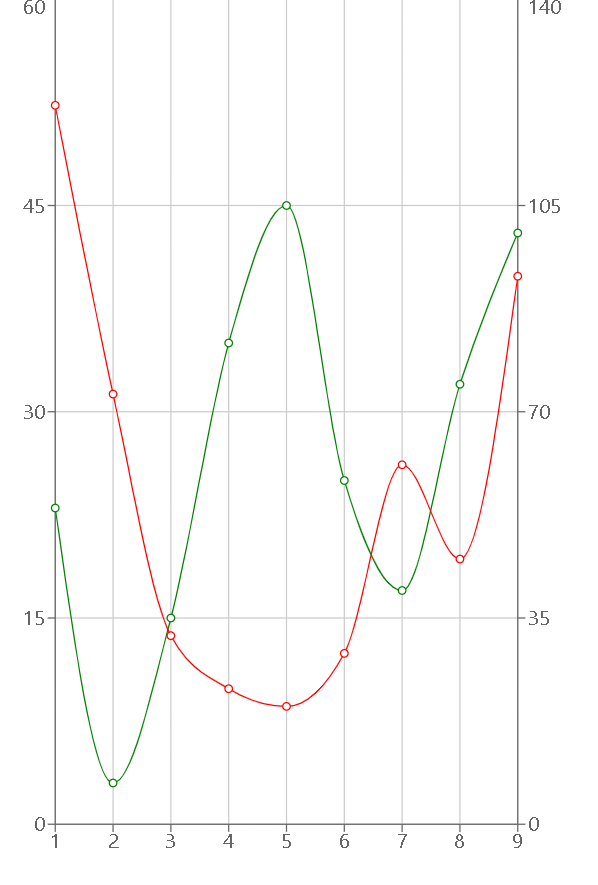
输出
示例 2:现在更改 App.js 文件中的以下代码。
应用程序.js
import React from 'react';
import { LineChart, Line, XAxis, YAxis, CartesianGrid} from 'recharts';


const App = () => {

// Sample data
const data = [
  {x:1, y:123,  z:122},
  {x:2, y:113,   z:713},
  {x:3, y:125,  z:312},
  {x:4, y:235,  z:123},
  {x:5, y:145,  z:420},
  {x:6, y:25,  z:529},
  {x:7, y:117,  z:61},
  {x:8, y:32,  z:435},
  {x:9, y:143,  z:93},
];


return (


);
}

export default App;
输出:使用CTRL+S 保存代码。现在打开浏览器并转到http://localhost:3000/ ,您将看到以下输出:
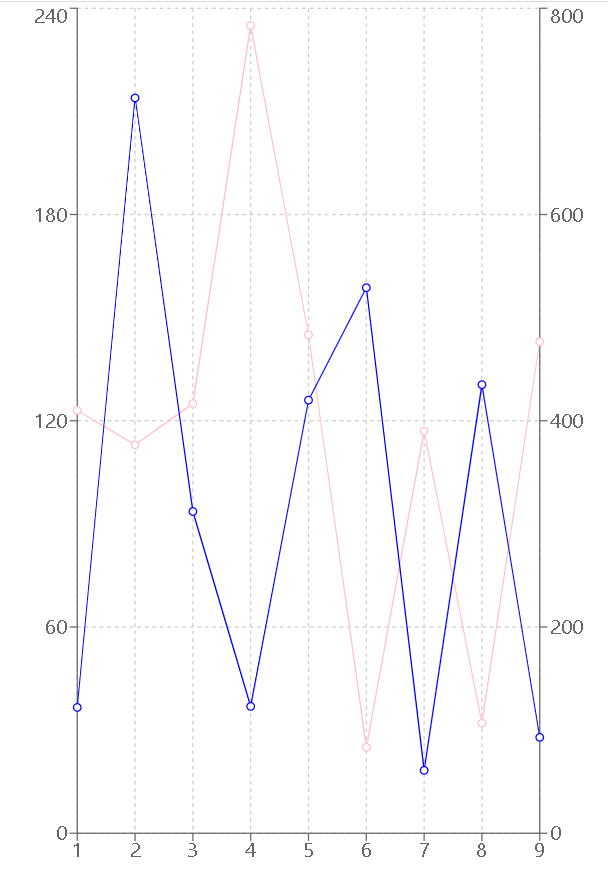
输出
参考: https://recharts.org/en-US/examples