先决条件:比较冒泡排序,插入排序和选择排序。
编写一个C程序来绘制和分析冒泡排序,插入排序和选择排序的时间复杂性(使用Gnuplot)。
根据问题,我们仅需使用C即可绘制时间复杂度图。因此,我们将使排序算法作为函数,并且给出所有算法以对完全相同的数组进行排序,以保持比较公平。
例子:
Input: randomly generated arrays (using rand() function)
    of different sizes as input for sorting.
Output:
A_size, Bubble, Insertion, Selection
10000, 366263, 80736, 152975
20000, 1594932, 332101, 609388
30000, 3773121, 785790, 1441547
40000, 7174455, 1574855, 2620006
50000, 10917061, 2029586, 4025993
60000, 15484338, 2998403, 5556494
70000, 21201561, 4146680, 7678139
80000, 29506758, 6027335, 10131950
90000, 36457272, 6699452, 12436376
100000, 43472313, 8335881, 15208712
方法:我们将使用大小不同的数组在排序算法所花费的时间与数组大小之间绘制图形。该程序的执行将需要一些时间来对大小最多为100000个元素的数组进行排序。
下面是上述方法的实现:
// C program to store time taken by bubble sort,
// insertion sort and selection sort
// for sorting exactly same arrays.

#include
#include
#include

// Swap utility
void swap(long int* a, long int* b)
{
    int tmp = *a;
    *a = *b;
    *b = tmp;
}

// Bubble sort
void bubbleSort(long int a[], long int n)
{
    for (long int i = 0; i < n - 1; i++) {
        for (long int j = 0; j < n - 1 - i; j++) {
            if (a[j] > a[j + 1]) {
                swap(&a[j], &a[j + 1]);
            }
        }
    }
}

// Insertion sort
void insertionSort(long int arr[], long int n)
{
    long int i, key, j;
    for (i = 1; i < n; i++) {
        key = arr[i];
        j = i - 1;

        // Move elements of arr[0..i-1], that are
        // greater than key, to one position ahead
        // of their current position
        while (j >= 0 && arr[j] > key) {
            arr[j + 1] = arr[j];
            j = j - 1;
        }
        arr[j + 1] = key;
    }
}

// Selection sort
void selectionSort(long int arr[], long int n)
{
    long int i, j, midx;

    for (i = 0; i < n - 1; i++) {

        // Find the minimum element in unsorted array
        midx = i;

        for (j = i + 1; j < n; j++)
            if (arr[j] < arr[min_idx])
                midx = j;

        // Swap the found minimum element
        // with the first element
        swap(&arr[midx], &arr[i]);
    }
}

// Driver code
int main()
{
    long int n = 10000;
    int it = 0;

    // Arrays to store time duration
    // of sorting algorithms
    double tim1[10], tim2[10], tim3[10];

    printf("A_size, Bubble, Insertion, Selection\n");

    // Performs 10 iterations
    while (it++ < 10) {
        long int a[n], b[n], c[n];

        // generating n random numbers
        // storing them in arrays a, b, c
        for (int i = 0; i < n; i++) {
            long int no = rand() % n + 1;
            a[i] = no;
            b[i] = no;
            c[i] = no;
        }

        // using clock_t to store time
        clock_t start, end;

        // Bubble sort
        start = clock();
        bubbleSort(a, n);
        end = clock();

        tim1[it] = ((double)(end - start));

        // Insertion sort
        start = clock();
        insertionSort(b, n);
        end = clock();

        tim2[it] = ((double)(end - start));

        // Selection sort
        start = clock();
        selectionSort(c, n);
        end = clock();

        tim3[it] = ((double)(end - start));

        // type conversion to long int
        // for plotting graph with integer values
        printf("%li, %li, %li, %li\n",
               n,
               (long int)tim1[it],
               (long int)tim2[it],
               (long int)tim3[it]);

        // increases the size of array by 10000
        n += 10000;
    }

    return 0;
}
输出:
A_size, Bubble, Insertion, Selection
10000, 366263, 80736, 152975
20000, 1594932, 332101, 609388
30000, 3773121, 785790, 1441547
40000, 7174455, 1574855, 2620006
50000, 10917061, 2029586, 4025993
60000, 15484338, 2998403, 5556494
70000, 21201561, 4146680, 7678139
80000, 29506758, 6027335, 10131950
90000, 36457272, 6699452, 12436376
100000, 43472313, 8335881, 15208712
现在出现了一个问题,我们将如何在xy坐标上绘制图形?
为此,我们将使用一个非常简单的实用程序Gnuplot。
Gnuplot是可移植的命令行驱动的图形实用程序,适用于Linux,MS Windows,OSX和许多其他平台。
注意:在本文中,使用Ubuntu(Linux)。
- 首先,如何安装Gnuplot。使用此命令安装Gnuplot。
sudo apt-get install gnuplot - 之后,编译您的代码,并使用此命令将输出复制到文本文件中。
./a.out>plot.txt - 只需使用即可打开Gnuplot。
gnuplot - 现在,最后一件事是绘制图形,因此请使用此命令绘制复杂度图形。
plot './plot.txt' using 1:2 with linespoints,
'./plot.txt' using 1:3 with linespoints,
'./plot.txt' using 1:4 with linespoints
这是命令的终端快照。 
这是比较气泡排序(紫色曲线),插入排序(绿色曲线)和选择排序(蓝色曲线)的复杂度图。 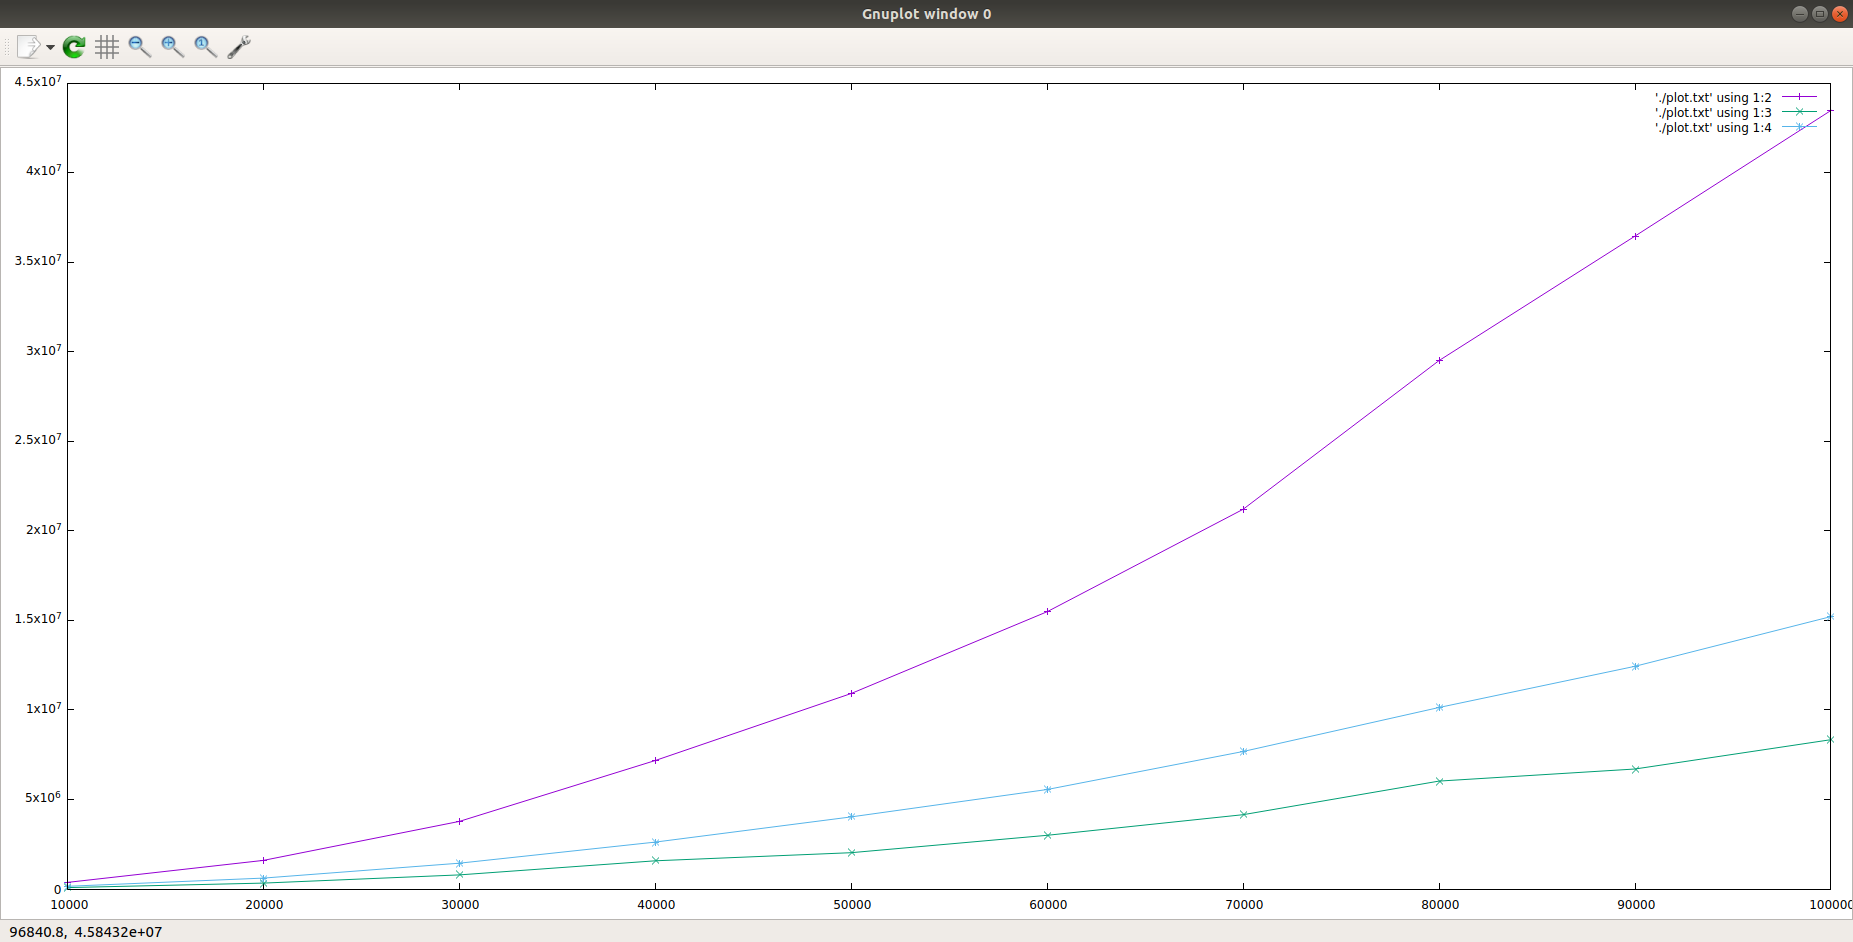
观察:
三种算法的平均时间复杂度均为O(n ^ 2),但是随着输入数据大小的增加,插入排序的性能远优于冒泡排序,并且略胜于选择排序。
想要从精选的最佳视频中学习和练习问题,请查看《基础到高级C的C基础课程》。