Google Cloud的Vision API具有多种功能。在本文中,我们将看到如何访问它们。使用API之前,您需要打开Google Developer帐户,创建虚拟机实例并设置API。为此,请参阅本文。
我们需要下载以下软件包–
pip install google.cloud.visionGoogle Vision API执行的各种服务包括–
人脸检测:
它可以检测图像中的多张面孔并表达面孔的情绪状态。
使用Python代码将’credetials.json’文件与.py文件保存在同一文件夹中。我们需要将“ credentials.json”(C:\ Users \…)的路径另存为“ GOOGLE_APPLICATION_CREDENTIALS”,该过程已在以下代码的第7行中完成。
import os
import io
from google.cloud import vision
from matplotlib import pyplot as plt
from matplotlib import patches as pch

os.environ['GOOGLE_APPLICATION_CREDENTIALS'] =
      os.path.join(os.curdir, 'credentials.json')

client = vision.ImageAnnotatorClient()

f = 'image_filename.jpg'
with io.open(f, 'rb') as image:
    content = image.read()

image = vision.types.Image(content = content)
response = client.face_detection(image = image)
faces = response.face_annotations

possibility = ('UNKNOWN', 'VERY_UNLIKELY', 'UNLIKELY',
                  'POSSIBLE', 'LIKELY', 'VERY_LIKELY')

a = plt.imread(f)
fig, ax = plt.subplots(1)
ax.imshow(a)

for face in faces:
    print('Possibility of anger: {}'.format(possibility[face.anger_likelihood]))
    print('Possibility of joy: {}'.format(possibility[face.joy_likelihood]))
    print('Possibility of surprise: {}'.format(possibility[face.surprise_likelihood]))
    print('Possibility of sorrow: {}'.format(possibility[face.sorrow_likelihood]))

    vertices = ([(vertex.x, vertex.y)
                 for vertex in face.bounding_poly.vertices])

    print('Vertices covering face: {}\n\n'.format(vertices))

    rect = pch.Rectangle(vertices[0], (vertices[1][0] - vertices[0][0]),
                        (vertices[2][1] - vertices[0][1]), linewidth = 1,
                                       edgecolor ='r', facecolor ='none')
    ax.add_patch(rect)

print('Confidence in Detection: {}%'.format(
            face.detection_confidence * 100))

plt.show()
上面的代码检测图片中的多个面孔,并确定面孔所表现出的情感表情以及是否有任何面孔戴着头饰。它还返回在各个面周围形成矩形的顶点。
最后,它打印得出结论的担保人的百分比。
例如,当以下图像作为输入给出时– 
输出:
Possibility of anger: VERY_UNLIKELY
Possibility of joy: VERY_LIKELY
Possibility of surprise: VERY_UNLIKELY
Possibility of sorrow: VERY_UNLIKELY
Vertices covering face: [(115, 84), (308, 84), (308, 309), (115, 309)]

Confidence in Detection: 99.93739128112793%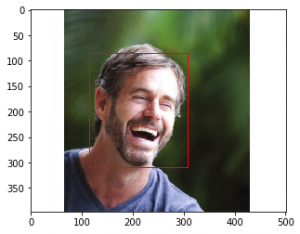
徽标检测:
检测图像中存在的流行产品徽标。
import os
import io
from google.cloud import vision
from matplotlib import pyplot as plt

os.environ['GOOGLE_APPLICATION_CREDENTIALS'] =
     os.path.join(os.curdir, 'credentials.json')

client = vision.ImageAnnotatorClient()

f = 'image_filename.jpg'
with io.open(f, 'rb') as image:
    content = image.read()

image = vision.types.Image(content = content)
response = client.logo_detection(image = image)
logos = response.logo_annotations

a = plt.imread(f)
plt.imshow(a)

for logo in logos:
    print(logo.description)
上面的代码检测图像中各个公司的徽标,并打印公司名称。例如,当给出以下图像时: 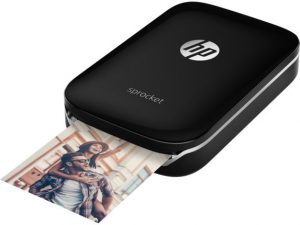
输出:
hp标签检测:
检测图像中的广泛类别,范围从动物,树木到车辆,建筑物等。
import os
import io
from google.cloud import vision
from matplotlib import pyplot as plt

os.environ['GOOGLE_APPLICATION_CREDENTIALS'] =
    os.path.join(os.curdir, 'credentials.json')

client = vision.ImageAnnotatorClient()

f = 'image_filename.jpg'
with io.open(f, 'rb') as image:
    content = image.read()

image = vision.types.Image(content = content)
response = client.label_detection(image = image)
labels = response.label_annotations

a = plt.imread(f)
plt.imshow(a)

for label in labels:
    print(label.description)
所有可能的标签或标签都贴在图像上。例如,当以下图像作为输入给出时: 
输出:
Street
Neighbourhood
Café
Coffeehouse
Sitting
Leisure
Tourism
Restaurant
Street performance
City
地标检测:
检测图像中的著名地标(主要是人造的)。
import os
import io
from google.cloud import vision
from matplotlib import pyplot as plt

os.environ['GOOGLE_APPLICATION_CREDENTIALS'] =
    os.path.join(os.curdir, 'credentials.json')

client = vision.ImageAnnotatorClient()

f = 'image_filename.jpg'
with io.open(f, 'rb') as image:
    content = image.read()

image = vision.types.Image(content = content)
response = client.landmark_detection(image = image)
landmarks = response.landmark_annotations

a = plt.imread(f)
plt.imshow(a)

for landmark in landmarks:
    print(landmark.description)
    for location in landmark.locations:
        print('Latitude: {}, Longitude: {}'.format(
              location.lat_lng.latitude, location.lat_lng.longitude))
上面的代码可识别任何著名的地标,并使用纬度和经度返回该地标的位置。例如,当我们输入以下图片时: 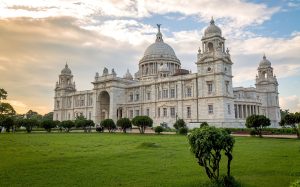
输出:
Victoria Memorial
Latitude: 22.545121, Longitude: 88.342781
有关更多信息,请在此处访问Google Vision API文档。