在 Pandas 中折叠多个列
在 Pandas 中操作数据框时,我们可能会遇到折叠列的情况。随它去
多列的累积数据或基于其他要求的折叠。让我们看看如何在 Pandas 中折叠多个列。
要在 Pandas 中折叠多个列,应遵循以下步骤:
第 1 步:加载 numpy 和 Pandas。
第 2 步:创建随机数据并使用它们创建 pandas 数据框。
步骤#3:通过为每个具有名称的列表创建一个字典,将多个列表转换为一个数据框。
步骤#4:然后将 Pandas 数据框用于 dict。包含数据列和名称列的数据框已准备就绪。
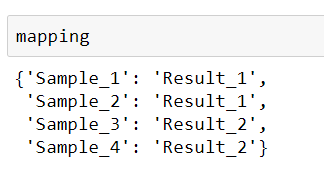
步骤#5:指定要折叠的列。这可以通过将映射指定为字典来完成,其中键是要组合或折叠的列的名称,值是结果列的名称。
示例 1:
# Python program to collapse
# multiple Columns using Pandas
import pandas as pd
# sample data
n = 3
Sample_1 = [57, 51, 6]
Sample_2 = [92, 16, 19]
Sample_3 = [15, 93, 71]
Sample_4 = [28, 73, 31]
sample_id = zip(["S"]*n, list(range(1, n + 1)))
s_names = [''.join([w[0], str(w[1])]) for w in sample_id]
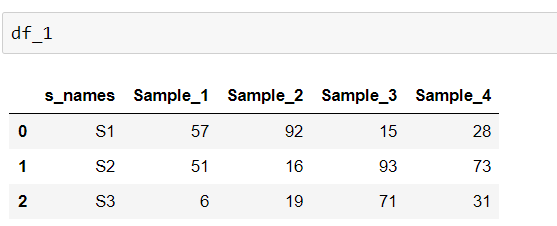
d = {'s_names': s_names, 'Sample_1': Sample_1,
'Sample_2': Sample_2, 'Sample_3': Sample_3,
'Sample_4': Sample_4}
df_1 = pd.DataFrame(d)
mapping = {'Sample_1': 'Result_1',
'Sample_2': 'Result_1',
'Sample_3': 'Result_2',
'Sample_4': 'Result_2'}
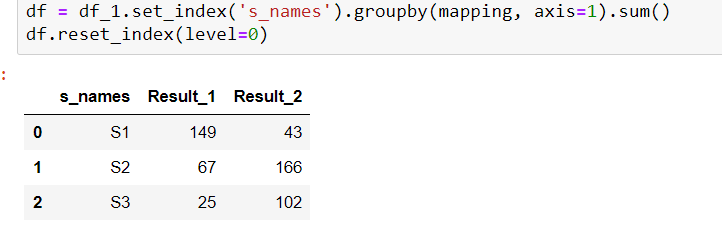
df = df_1.set_index('s_names').groupby(mapping, axis = 1).sum()
df.reset_index(level = 0)
输出: 
示例 2:
# Python program to collapse
# multiple Columns using Pandas
import pandas as pd
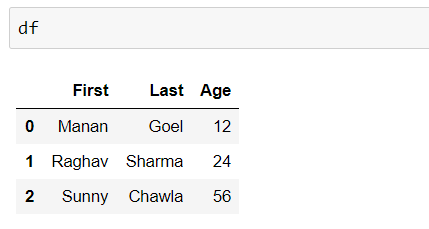
df = pd.DataFrame({'First': ['Manan ', 'Raghav ', 'Sunny '],
'Last': ['Goel', 'Sharma', 'Chawla'],
'Age':[12, 24, 56]})
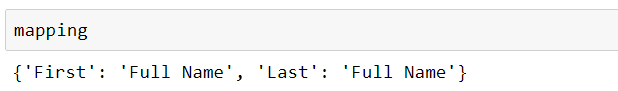
mapping = {'First': 'Full Name', 'Last': 'Full Name'}
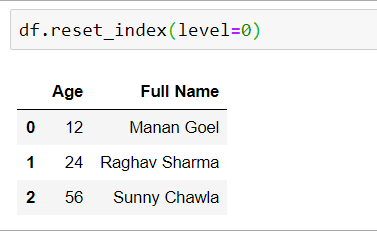
df = df.set_index('Age').groupby(mapping, axis = 1).sum()
df.reset_index(level = 0)
输出: