设置 Matplotlib 颜色条大小以匹配图形
先决条件: Matplotlib
需要匹配图形或图像的颜色条大小才能获得良好的可视化效果。这可以使用以下任何一种方法来实现。
方法 1:使用分数参数
colorbar()中的分数参数用于设置颜色条的大小。使用它,我们可以将颜色条大小与图形匹配为:
- 如果使用垂直颜色条,则分数=0.047 * (height_of_image / width_of_image)
- 如果使用水平颜色条,则分数=0.047 * (width_of_image / height_of_image)
方法
- 导入模块
- 绘制图形
- 设置分数参数
- 绘制颜色条
- 显示图
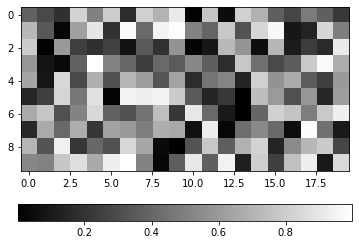
示例 1:
Python3
import matplotlib.pyplot as plt
import numpy as np

# Plot an image
a = np.random.random((10, 20))
plt.imshow(a, cmap='gray')

# Calculate (height_of_image / width_of_image)
im_ratio = a.shape[0]/a.shape[1]

# Plot vertical colorbar
plt.colorbar(fraction=0.047*im_ratio)
plt.show()
Python3
import matplotlib.pyplot as plt
import numpy as np

# Plot an image
a = np.random.random((10, 20))
plt.imshow(a, cmap='gray')

# Calculate (width_of_image/height_of_image)
im_ratio = a.shape[1]/a.shape[0]

# Plot horizontal colorbar
plt.colorbar(orientation="horizontal", fraction=0.047*im_ratio)
plt.show()
Python3
import matplotlib.pyplot as plt
from mpl_toolkits.axes_grid1 import make_axes_locatable
import numpy as np

# Plot image on axes ax
ax = plt.gca()
img = np.random.random((10, 20))
im = plt.imshow(img, cmap='gray')

# Divide existing axes and create new axes
# at bottom side of image
divider = make_axes_locatable(ax)
cax = divider.append_axes("bottom", size="5%", pad=0.25)

# Plot horizontal colorbar
plt.colorbar(im, orientation="horizontal", cax=cax)
plt.show()
Python3
import matplotlib.pyplot as plt
from mpl_toolkits.axes_grid1 import make_axes_locatable
import numpy as np

# Plot image on axes ax
ax = plt.gca()
img = np.random.random((10, 20))
im = plt.imshow(img, cmap='gray')

# Divide existing axes and create
# new axes at right side of image
divider = make_axes_locatable(ax)
cax = divider.append_axes("right", size="5%", pad=0.15)

# Plot vertical colorbar
plt.colorbar(im, cax=cax)
plt.show()
Python3
import matplotlib.pyplot as plt
import numpy as np

# Plot image
fig = plt.figure()
ax = plt.axes()
img = np.random.random((10, 20))
im = plt.imshow(img, cmap='gray')

# Create new axes according to image position
cax = fig.add_axes([ax.get_position().x1+0.01,
                    ax.get_position().y0,
                    0.02,
                    ax.get_position().height])

# Plot vertical colorbar
plt.colorbar(im, cax=cax)
plt.show()
Python3
import matplotlib.pyplot as plt
import numpy as np

# Plot an image
fig = plt.figure()
ax = plt.axes()
img = np.random.random((10, 20))
im = plt.imshow(img, cmap='gray')

# Create new axes according to image position
cax = fig.add_axes([ax.get_position().x0,
                    ax.get_position().y0-0.08,
                    ax.get_position().width,
                    0.02])

# Plot horizontal colorbar on created axes
plt.colorbar(im, orientation="horizontal", cax=cax)
plt.show()
输出:

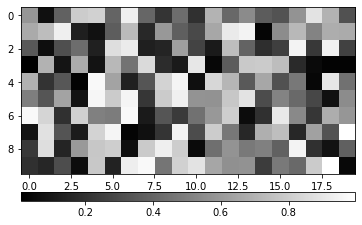
示例 2:
蟒蛇3
import matplotlib.pyplot as plt
import numpy as np

# Plot an image
a = np.random.random((10, 20))
plt.imshow(a, cmap='gray')

# Calculate (width_of_image/height_of_image)
im_ratio = a.shape[1]/a.shape[0]

# Plot horizontal colorbar
plt.colorbar(orientation="horizontal", fraction=0.047*im_ratio)
plt.show()
输出:
方法二:使用axes_grid1工具包
Axis_grid1 提供了一个辅助函数make_axes_locatable() ,它接受一个现有的轴实例并为其创建一个分隔符。它提供了append_axes()方法,该方法在原始轴的给定侧(“顶部”、“右侧”、“底部”和“左侧”)创建一个新轴。
方法:
- 导入模块
- 绘图图像
- 使用make_axes_locatable()划分现有轴实例
- 使用append_axes()创建新轴
- 使用“顶部”或“底部”作为水平颜色条
- 使用“左侧”或“右侧”作为垂直颜色条
- 在创建的轴上绘制颜色条
示例 1:
蟒蛇3
import matplotlib.pyplot as plt
from mpl_toolkits.axes_grid1 import make_axes_locatable
import numpy as np

# Plot image on axes ax
ax = plt.gca()
img = np.random.random((10, 20))
im = plt.imshow(img, cmap='gray')

# Divide existing axes and create new axes
# at bottom side of image
divider = make_axes_locatable(ax)
cax = divider.append_axes("bottom", size="5%", pad=0.25)

# Plot horizontal colorbar
plt.colorbar(im, orientation="horizontal", cax=cax)
plt.show()
输出:
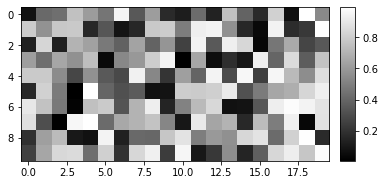
示例 2:
蟒蛇3
import matplotlib.pyplot as plt
from mpl_toolkits.axes_grid1 import make_axes_locatable
import numpy as np

# Plot image on axes ax
ax = plt.gca()
img = np.random.random((10, 20))
im = plt.imshow(img, cmap='gray')

# Divide existing axes and create
# new axes at right side of image
divider = make_axes_locatable(ax)
cax = divider.append_axes("right", size="5%", pad=0.15)

# Plot vertical colorbar
plt.colorbar(im, cax=cax)
plt.show()
输出:
方法 3:使用 add_axes() 方法
使用add_axes()方法为颜色条提供自己的轴,可以是一种获得与给定图像匹配的颜色条的方法。
方法:
- 绘制图形
- 使用带有位置参数的add_axes()方法创建轴:
- 对于图像右侧的垂直颜色条:
- 左:颜色条的左点=图像的右端位置
- 底部:颜色条的底点=图像的底端位置
- 宽度:颜色条的宽度
- 高度:颜色条的高度=图像的高度
- 对于水平颜色条 在图像底部:
- 左:颜色条的左点=图像的左端位置
- 底部:颜色条的底点=图像的底端位置
- 宽度:颜色条的宽度=图像的宽度
- 高度:颜色条的高度
- 对于图像右侧的垂直颜色条:
- 在创建的轴上绘制颜色条
示例 1:
蟒蛇3
import matplotlib.pyplot as plt
import numpy as np

# Plot image
fig = plt.figure()
ax = plt.axes()
img = np.random.random((10, 20))
im = plt.imshow(img, cmap='gray')

# Create new axes according to image position
cax = fig.add_axes([ax.get_position().x1+0.01,
                    ax.get_position().y0,
                    0.02,
                    ax.get_position().height])

# Plot vertical colorbar
plt.colorbar(im, cax=cax)
plt.show()
输出:

示例 2:
蟒蛇3
import matplotlib.pyplot as plt
import numpy as np

# Plot an image
fig = plt.figure()
ax = plt.axes()
img = np.random.random((10, 20))
im = plt.imshow(img, cmap='gray')

# Create new axes according to image position
cax = fig.add_axes([ax.get_position().x0,
                    ax.get_position().y0-0.08,
                    ax.get_position().width,
                    0.02])

# Plot horizontal colorbar on created axes
plt.colorbar(im, orientation="horizontal", cax=cax)
plt.show()
输出:
