温索化
Winsorization 是替换统计数据的极值的过程,以限制异常值对计算或使用该数据获得的结果的影响。这种极值替换后计算的平均值称为winsorized平均值。
例如,90% winsorization 意味着替换前 5% 和后 5% 的数据。数据的前 5% 由第 95 个百分位的数据值替换,数据的后 5% 的值由第 5 个百分位的数据值替换。
输入:
- 一个数值数组,其上端和下端的值将被 winsorized。
- 元组的第一个参数是要被 winsorized 的下端值的百分比。
- 元组的第二个参数是要被 winsorized 的上端值的百分比。
输出:
一个数值数组,其上端和下端的值按照用户的定义进行 winsorized。
示例#1:
Python3
# Libraries to be imported
import numpy as np
import matplotlib.pyplot as plt
import random
from scipy.stats.mstats import winsorize
Python3
# Creating an array with 100 random values
array = [np.random.randint(100) for i in range(100)]

# Creating outliers
# Here, the values which are selected for creating outliers
# are appended so that same outliers are not created again.
AlreadySelected = []
i = 0

# Creating 5 outliers on the lower end
while (i < 5):
    x = np.random.choice(array)  # Randomly selecting a value from the array
    y = x - mean*3
    array = np.append(array, y)
    if (x not in already_selected):
        AlreadySelected.append(y)

        i += 1

    else:
        continue

# Creating 5 outliers on the upper end
i = 0
while (i < 5):
    x = np.random.choice(array)  # Randomly selecting a value from the array
    y = x + mean*4
    array = np.append(array, y)
    if (x not in already_selected):
        AlreadySelected.append(y)

        i += 1

    else:
        continue

std = np.std(array)  # Storing the standard deviation of the array
mean = np.mean(array)  # Storing the mean of the array

plt.boxplot(array)
plt.title('Array with Outliers')
plt.show()
Python3
print(mean) # mean of the numeric array with outliersPython3
WinsorizedArray = winsorize(array,(0.05,0.05))

plt.boxplot(WinsorizedArray)
plt.title('Winsorized array')
plt.show()
Python3
WinsorizedMean = np.mean(WinsorizedArray)
print(WinsorizedMean)
Python3
# Creating another array with 100 random values
array2 = [np.random.randint(100) for i in range(100)]
std = np.std(array2)
mean = np.mean(array2)
AlreadySelected = []
# Creating outliers on the upper end
i = 0
while (i<5):
    x = np.random.choice(array2) # Randomly selecting a value from the array
    y = x + mean*4
    array2 = np.append(array2,y)
    if (x not in AlreadySelected):
        AlreadySelected.append(y)

        i+=1

    else:
        continue

plt.boxplot(array2)
plt.title('Array with outliers')
plt.show()
Python3
OutlierArray2Mean = np.mean(array2)
print(OutlierArray2Mean)
Python3
WinsorizedArray2 = winsorize(array2,(0.1,0.1))
# In this case, the lower 10% values of
# the data will have their values set equal to the value of the data point at
#the 10th percentile.

plt.boxplot(WinsorizedArray2)
plt.show()

WinsorizedArray2Mean = np.mean(WinsorizedArray2)
Python3
WinsorizedArray2Mean = np.mean(WinsorizedArray2)
print(WinsorizedArray2Mean)
让我们看一个示例,其中数据的上端和下端都存在异常值。
蟒蛇3
# Creating an array with 100 random values
array = [np.random.randint(100) for i in range(100)]
# Creating outliers
# Here, the values which are selected for creating outliers
# are appended so that same outliers are not created again.
AlreadySelected = []
i = 0
# Creating 5 outliers on the lower end
while (i < 5):
x = np.random.choice(array) # Randomly selecting a value from the array
y = x - mean*3
array = np.append(array, y)
if (x not in already_selected):
AlreadySelected.append(y)
i += 1
else:
continue
# Creating 5 outliers on the upper end
i = 0
while (i < 5):
x = np.random.choice(array) # Randomly selecting a value from the array
y = x + mean*4
array = np.append(array, y)
if (x not in already_selected):
AlreadySelected.append(y)
i += 1
else:
continue
std = np.std(array) # Storing the standard deviation of the array
mean = np.mean(array) # Storing the mean of the array
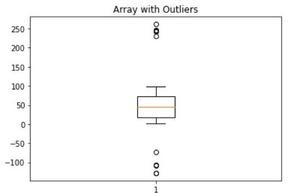
plt.boxplot(array)
plt.title('Array with Outliers')
plt.show()
输出:
蟒蛇3
print(mean) # mean of the numeric array with outliers
输出:

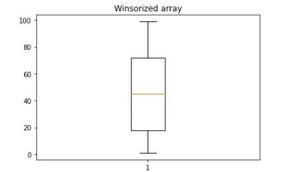
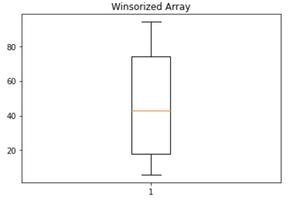
现在,我们对数组进行 10% 的 winsorize,即我们对数组的最高值的 5% 和最低值的 5% 进行 winsorize:
蟒蛇3
WinsorizedArray = winsorize(array,(0.05,0.05))

plt.boxplot(WinsorizedArray)
plt.title('Winsorized array')
plt.show()
输出:
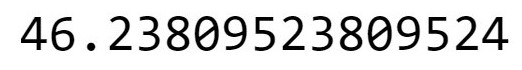
蟒蛇3
WinsorizedMean = np.mean(WinsorizedArray)
print(WinsorizedMean)
输出:

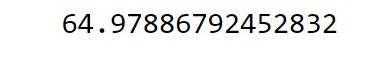
在这种情况下,数据的平均值只有轻微的变化。
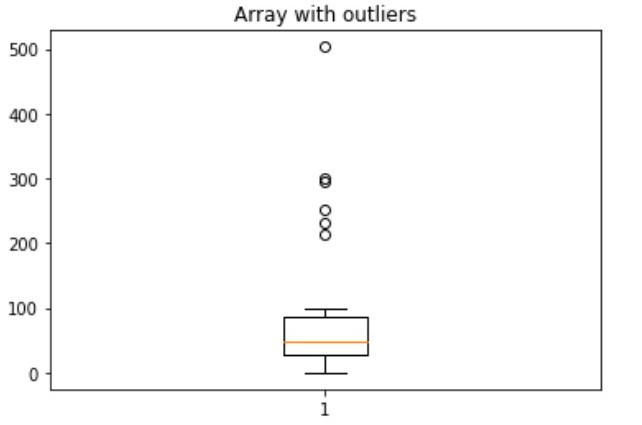
现在,让我们看一个示例,其中异常值仅出现在数据的一端。
蟒蛇3
# Creating another array with 100 random values
array2 = [np.random.randint(100) for i in range(100)]
std = np.std(array2)
mean = np.mean(array2)
AlreadySelected = []
# Creating outliers on the upper end
i = 0
while (i<5):
    x = np.random.choice(array2) # Randomly selecting a value from the array
    y = x + mean*4
    array2 = np.append(array2,y)
    if (x not in AlreadySelected):
        AlreadySelected.append(y)

        i+=1

    else:
        continue

plt.boxplot(array2)
plt.title('Array with outliers')
plt.show()
输出:
蟒蛇3
OutlierArray2Mean = np.mean(array2)
print(OutlierArray2Mean)
输出:
蟒蛇3
WinsorizedArray2 = winsorize(array2,(0.1,0.1))
# In this case, the lower 10% values of
# the data will have their values set equal to the value of the data point at
#the 10th percentile.

plt.boxplot(WinsorizedArray2)
plt.show()

WinsorizedArray2Mean = np.mean(WinsorizedArray2)
输出:
蟒蛇3
WinsorizedArray2Mean = np.mean(WinsorizedArray2)
print(WinsorizedArray2Mean)
输出:
在这种情况下,平均值存在显着差异。