为来自一个Python脚本的相同数据绘制多个单独的图表
使用Python绘制不同类型的地图和不同数据的绘图非常容易。 Python中这样一个有用的库是Matplotlib ,它对于使用相同的数据创建不同类型的图非常有用。
安装 Matplotlib 的最简单方法是在命令行中使用pip命令,如下所示:
pip install matplotlib此外,我们使用numpy和pandas库来创建和使用数据集。因此,安装 numpy 和 pandas 库也可以在命令行中使用 pip 命令完成。
pip install numpy
pip install pandas为了使图表富有创意并易于在图表中找到定位数据,我们使用了plotly和cufflinks库。要使用这些库,安装方法也与上述库相同。
pip install chart_studio.plotly
pip install cufflinks
在本文中,我们将创建一个绘图仪,使我们能够使用相同的数据创建不同类型的绘图。
在这个程序中,我们首先给出选择绘制图形所需的数据集的选项。使用 if-elif 语句有 3 个选项可用。
- 使用 100 行和 5 列创建随机数据
- 4行5列的用户输入数据集
- 上传 CSV/JSON 文件
第二步是决定要使用整个数据集或特定列绘制的图。最后,我们展示了用户想要绘制他们的数据并相应地绘制图表的不同类型的绘图仪。
下面是实现:
Python3
# importing required libraries
import numpy as np
import pandas as pd
import chart_studio.plotly as pl
import plotly.offline as po
import cufflinks as cf
po.init_notebook_mode(connected = True)
cf.go_offline()

# define a function for creating
# data set for plotting graph
def createdata(data):

    # creating random data set
    if(data == 1):
        x = np.random.rand(100,5)
        df1 = pd.DataFrame(x, columns = ['A', 'B',
                                        'C', 'D',
                                        'E'])

    # creating user data set with input
    elif(data == 2):
        x = [0, 0, 0, 0, 0]
        r1 = [0, 0, 0, 0, 0]
        r2 = [0, 0, 0, 0, 0]
        r3 = [0, 0, 0, 0, 0]
        r4 = [0, 0, 0, 0, 0]

        print('Enter the values for columns')
        i = 0

        for i in [0, 1, 2, 3, 4]:
            x[i] = input()
            i = i + 1
        print('Enter the values for first row')
        i = 0

        for i in [0, 1, 2, 3, 4]:
            r1[i] = int(input())
            i = i + 1

        print('Enter the values for second row')
        i = 0

        for i in [0, 1, 2, 3, 4]:
            r2[i] = int(input())
            i = i + 1

        print('Enter the values for third row')
        i = 0

        for i in [0, 1, 2, 3, 4]:
            r3[i] = int(input())
            i = i + 1

        print('Enter the values for fourth row')
        i = 0

        for i in [0, 1, 2, 3, 4]:
            r4[i] = int(input())
            i = i + 1

        df1 = pd.DataFrame([r1,r2,r3,r4] ,
                           columns = x)
    # creating data set by csv file
    elif(data == 3):
        file = input('Enter the file name')
        x = pd.read_csv(file)
        df1 = pd.DataFrame(x)

    else:
        print('DataFrame creation failed please' +
              'enter in between 1 to 3 and try again')

    return df1

# define a function for
# types of plotters
def plotter(plot):

    if(plot == 1):
        finalplot = df1.iplot(kind = 'scatter')

    elif(plot == 2):
        finalplot = df1.iplot(kind = 'scatter', mode = 'markers',
                              symbol = 'x', colorscale = 'paired')
    elif(plot == 3):
        finalplot = df1.iplot(kind = 'bar')

    elif(plot == 4):
        finalplot = df1.iplot(kind = 'hist')

    elif(plot == 5):
        finalplot = df1.iplot(kind = 'box')

    elif(plot == 6):
        finalplot = df1.iplot(kind = 'surface')

    else:
        finalplot = print('Select only between 1 to 7')

    return finalplot

# define a function for allowing
# to plot for specific rows and columns
def plotter2(plot):

    col = input('Enter the number of columns you' +
                'want to plot by selecting only 1 , 2 or 3')

    col = int(col)

    if(col==1):

        colm = input('Enter the column you want to plot' +
                     'by selecting any column from dataframe head')
        if(plot == 1):
            finalplot = df1[colm].iplot(kind = 'scatter')

        elif(plot == 2):
            finalplot = df1[colm].iplot(kind = 'scatter', mode = 'markers',
                                        symbol = 'x', colorscale = 'paired')
        elif(plot == 3):
            finalplot = df1[colm].iplot(kind = 'bar')

        elif(plot == 4):
            finalplot = df1[colm].iplot(kind = 'hist')

        elif(plot == 5):
            finalplot = df1[colm].iplot(kind = 'box')

        elif(plot == 6 or plot == 7):
            finalplot = print('Bubble plot and surface plot require' +
                              'more than one column arguments')
        else:
            finalplot = print('Select only between 1 to 7')

    elif(col == 2):

        print('Enter the columns you want to plot' +
              'by selecting from dataframe head')

        x = input('First column')
        y = input('Second column')

        if(plot == 1):
            finalplot = df1[[x,y]].iplot(kind = 'scatter')

        elif(plot == 2):
            finalplot = df1[[x,y]].iplot(kind = 'scatter', mode = 'markers',
                                         symbol = 'x', colorscale = 'paired')
        elif(plot == 3):
            finalplot = df1[[x,y]].iplot(kind = 'bar')

        elif(plot == 4):
            finalplot = df1[[x,y]].iplot(kind = 'hist')

        elif(plot == 5):
            finalplot = df1[[x,y]].iplot(kind = 'box')

        elif(plot == 6):
            finalplot = df1[[x,y]].iplot(kind = 'surface')

        elif(plot == 7):
            size = input('Please enter the size column for bubble plot')
            finalplot = df1.iplot(kind = 'bubble', x = x,
                                  y = y, size = size)
        else:
            finalplot = print('Select only between 1 to 7')

    elif(col == 3):

        print('Enter the columns you want to plot')
        x = input('First column')
        y = input('Second column')
        z = input('Third column')

        if(plot == 1):
            finalplot = df1[[x,y,z]].iplot(kind = 'scatter')

        elif(plot == 2):
            finalplot = df1[[x,y,z]].iplot(kind = 'scatter', mode = 'markers',
                                           symbol = 'x' ,colorscale = 'paired')
        elif(plot == 3):
            finalplot = df1[[x,y,z]].iplot(kind = 'bar')

        elif(plot == 4):
            finalplot = df1[[x,y,z]].iplot(kind = 'hist')

        elif(plot == 5):
            finalplot = df1[[x,y,z]].iplot(kind = 'box')

        elif(plot == 6):
            finalplot = df1[[x,y,z]].iplot(kind = 'surface')

        elif(plot == 7):
            size = input('Please enter the size column for bubble plot')

            finalplot = df1.iplot(kind = 'bubble', x = x, y = y,
                                  z = z, size = size )
        else:
            finalplot = print('Select only between 1 to 7')
    else:
        finalplot = print('Please enter only 1 , 2 or 3')
    return finalplot

# define a main function
# for asking type of plot
# and calling respective function
def main(cat):

    if(cat == 1):

        print('Select the type of plot you need to plot by writing 1 to 6')
        print('1.Line plot')
        print('2.Scatter plot')
        print('3.Bar plot')
        print('4.Histogram')
        print('5.Box plot')
        print('6.Surface plot')
        plot = int(input())
        output = plotter(plot)

    elif(cat == 2):

        print('Select the type of plot you need to plot by writing 1 to 7')
        print('1.Line plot')
        print('2.Scatter plot')
        print('3.Bar plot')
        print('4.Histogram')
        print('5.Box plot')
        print('6.Surface plot')
        print('7.Bubble plot')
        plot = int(input())
        output = plotter2(plot)

    else:
        print('Please enter 1 or 2 and try again')

print('Select the type of data you need to plot(By writing 1,2 or 3)')
print('1.Random data with 100 rows and 5 columns')
print('2.Customize dataframe with 5 columns and. 4 rows')
print('3.Upload csv/json/txt file')

data = int(input())
df1 = createdata(data)
print('Your DataFrame head is given below check the columns to plot using cufflinks')

df1.head()
print('What kind of plot you need , the complete data plot or columns plot')
cat = input('Press 1 for plotting all columns or press 2 for specifying columns to plot')
cat = int(cat)

main(cat)
输出:
散点图:
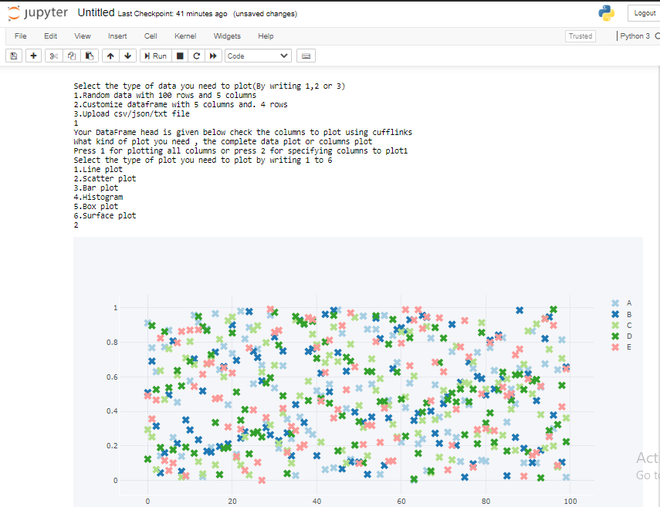
散点图
直方图:
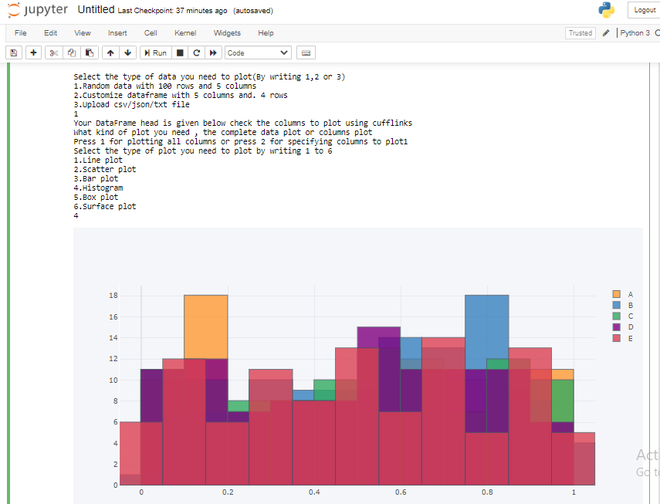
直方图
箱形图:
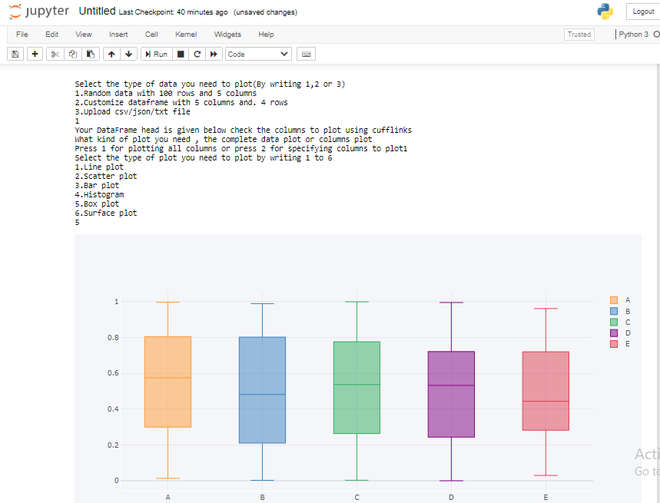
箱形图