表情符号作为 Matplotlib 中的标记
先决条件: Matplotlib
当我们绘制图形时,通常需要突出显示某些点并明确显示它们。这使我们的演示更加精确和信息丰富。它可以通过使用标记来实现。 Matplotlib 中的标记是一种强调绘制的每个点的方法。它们只不过是“绘制点”,可以与不同颜色、形状和大小的图表、散点图等一起使用。我们将看到如何使用表情符号作为图形中的标记,而不是使用传统的标记。
我们将讨论以下两种用于添加表情符号作为标记的方法:
- 使用 Unicode字符
- 在 AnnotationbBox 中使用 OffsetImage
使用 Unicode字符
Unicode 是对文本、数字等进行一致编码和处理的标准。我们也可以通过 Unicode字符来表示表情符号。例如,一张咧嘴笑的脸可以通过 U+1F600 来表示。 Unicode 可以通过不同的字符编码实现,如 UTF-8、UTF-16 和 UTF-32。在本例中,我们使用 UTF-8 编码系统。
方法:
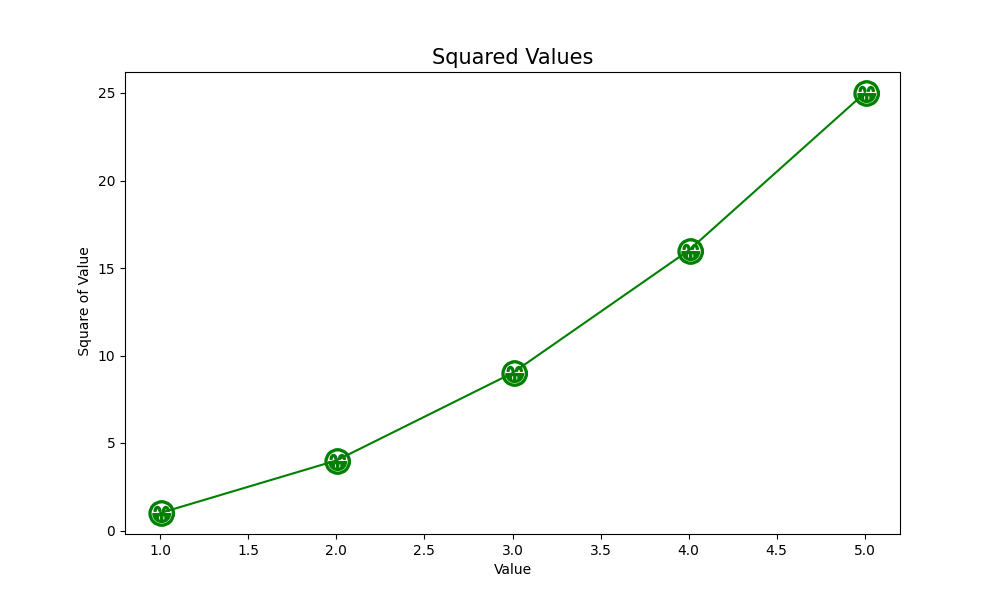
在下面给出的示例中,我们在图形上绘制给定数字列表的平方值。 x_values是从 1 到 5 的数字列表, y_values是另一个列表,由列表x_values中每个数字的平方值组成。
- matplotlib 库的 pyplot 模块中的matplotlib.pyplot.subplots()函数用于创建图形和一组子图。尽管它需要许多参数,但为了简单起见,我们只指定了图形大小。它返回一个元组(fig, ax)给出一个带有轴数组ax的单个图形fig 。
- ax.plot()接受 x 和 y 值、标记、标记大小 (ms) 和颜色 (c) 的列表。请注意,在指定标记时,Unicode字符前后都有一个美元 ($)符号。人们可以轻松找到他们想要的表情符号的 Unicode字符。
- 最后,使用ax.set()设置标题、x 和 y 标签。
- plt.show()在屏幕上显示图形。
例子:
Python3
# importing matplotlib module
import matplotlib.pyplot as plt

# defining a list of x and v values
x_values = [1, 2, 3, 4, 5]
y_values = [x*x for x in x_values]

# plotting the graph
fig, ax = plt.subplots(figsize=(10, 6))

# check that the marker value is given as
# '$U0001F601$'
ax.plot(x_values, y_values, marker='$\U0001F601$', ms=20, c='green')
ax.set_title('Squared Values', fontsize=15)
ax.set_xlabel('Value')
ax.set_ylabel('Square of Value')
plt.show()
Python3
# importing all important libraries
import matplotlib.pyplot as plt
from matplotlib.offsetbox import OffsetImage, AnnotationBbox
import numpy as np

# plotting the graph
fig, ax = plt.subplots()

x = np.linspace(0, 10, 20)
y = np.cos(x)
ax.set_title('Cosine Values', fontsize=15)
ax.set_xlabel('Value')
ax.set_ylabel('Cosine')

# reading the image
image = plt.imread('emoji.png')

# OffsetBox
image_box = OffsetImage(image, zoom=0.1)

# creating annotation for each point
# on the graph
x, y = np.atleast_1d(x, y)

# for each value of (x,y), we create
# an annotation
for x0, y0 in zip(x, y):
    ab = AnnotationBbox(image_box, (x0, y0), frameon=False)
    ax.add_artist(ab)

ax.plot(x,y, c='green')
plt.show()
输出:
在 AnnotationbBox 中使用 OffsetImage
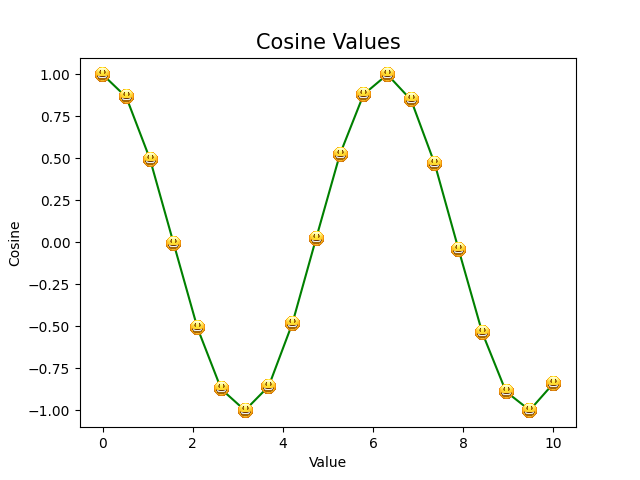
绘制图形时经常使用带有文本的点注释。但是,我们也可以使用图像对点进行注释。任何表情符号图像都可以用作使用 OffsetImage 和 AnnotationbBox 的注释。在下面给出的示例中,我们在图形上绘制了余弦值。表情符号用作每个点的标记。
方法:
- 和前面的例子一样,我们导入了所有必要的库。
- np.linspace()在指定的间隔内返回均匀间隔的数字。它接受参数:起始值,结束值, 和 我们想要的值的总数。这里我们得到 0 到 10 之间的 20 个值。
- np.cos()返回所有 x_values 的余弦。
- 使用plt.imread() ,将表情符号图像从文件读取到数组中。它以文件名作为参数。
- 通过matplotlib.offsetbox() ,我们将表情符号图像设置为offsetImage 。获取的参数包括图像和缩放值。将缩放值设置为常量可确保即使在放大图形时表情符号的大小也保持不变。
- np.atleast_1d()将提供的输入转换为至少具有一维的数组。传递 x 和 y 值会返回由它们的所有值组成的数组。
- zip()函数遍历 x 和 y 值。我们遍历 x 的每个值及其对应的 y 值并创建一个注释框。 AnnotationBbox()函数采用偏移框(我们创建的image_box )和绘制表情符号的(x, y)值。 frameon值保持为False以删除表情符号周围的方框。
- Add_artist() 方法占用我们创建的注释框(ab),然后返回这个添加的艺术家。
- 最后,我们使用ax.plot()绘制图形并将颜色设置为绿色。
- plt.show()在屏幕上显示图形。
例子:
蟒蛇3
# importing all important libraries
import matplotlib.pyplot as plt
from matplotlib.offsetbox import OffsetImage, AnnotationBbox
import numpy as np

# plotting the graph
fig, ax = plt.subplots()

x = np.linspace(0, 10, 20)
y = np.cos(x)
ax.set_title('Cosine Values', fontsize=15)
ax.set_xlabel('Value')
ax.set_ylabel('Cosine')

# reading the image
image = plt.imread('emoji.png')

# OffsetBox
image_box = OffsetImage(image, zoom=0.1)

# creating annotation for each point
# on the graph
x, y = np.atleast_1d(x, y)

# for each value of (x,y), we create
# an annotation
for x0, y0 in zip(x, y):
    ab = AnnotationBbox(image_box, (x0, y0), frameon=False)
    ax.add_artist(ab)

ax.plot(x,y, c='green')
plt.show()
输出: