R编程中的分类
R 是一种非常动态且通用的数据科学编程语言。本文讨论 R 中的分类。通常,R 中的分类器用于预测特定类别相关信息,如评论或评级,如好、最好或最差。
各种分类器有:
- 决策树
- 朴素贝叶斯分类器
- K-NN 分类器
- 支持向量机(SVM)
决策树分类器
它基本上是一个表示选择的图表。图中的节点或顶点表示一个事件,图的边表示决策条件。它的常见用途是机器学习和数据挖掘应用程序。
应用:
电子邮件的垃圾邮件/非垃圾邮件分类,预测肿瘤是否癌变。通常,模型是用标注的数据构建的,也称为训练数据集。然后使用一组验证数据来验证和改进模型。 R 有用于创建和可视化决策树的包。
R 包“party”用于创建决策树。
命令:
install.packages("party")Python3
# Load the party package. It will automatically load other
# dependent packages.
library(party)

# Create the input data frame.
input.data <- readingSkills[c(1:105), ]

# Give the chart file a name.
png(file = "decision_tree.png")

# Create the tree.
  output.tree <- ctree(
  nativeSpeaker ~ age + shoeSize + score,
  data = input.dat)

# Plot the tree.
plot(output.tree)

# Save the file.
dev.off()
Python3
library(caret)
## Warning: package 'caret' was built under R version 3.4.3
set.seed(7267166)
trainIndex = createDataPartition(mydata$prog, p = 0.7)$Resample1
train = mydata[trainIndex, ]
test = mydata[-trainIndex, ]

## check the balance
print(table(mydata$prog))
##
## academic    general vocational
## 105         45         50
print(table(train$prog))
Python3
# Write Python3 code here
import numpy as np
import pandas as pd
from matplotlib import pyplot as plt
from sklearn.datasets import load_breast_cancer
from sklearn.metrics import confusion_matrix
from sklearn.neighbors import KNeighborsClassifier
from sklearn.model_selection import train_test_split
import seaborn as sns
sns.set()
breast_cancer = load_breast_cancer()
X = pd.DataFrame(breast_cancer.data, columns = breast_cancer.feature_names)
X = X[['mean area', 'mean compactness']]
y = pd.Categorical.from_codes(breast_cancer.target, breast_cancer.target_names)
y = pd.get_dummies(y, drop_first = True)
X_train, X_test, y_train, y_test = train_test_split(X, y, random_state = 1)
sns.scatterplot(
    x ='mean area',
    y ='mean compactness',
    hue ='benign',
    data = X_test.join(y_test, how ='outer')
)
Python3
# Load the data from the csv file
dataDirectory <- "D:/" # put your own folder here
data <- read.csv(paste(dataDirectory, 'regression.csv', sep =""), header = TRUE)

# Plot the data
plot(data, pch = 16)

# Create a linear regression model
model <- lm(Y ~ X, data)

# Add the fitted line
abline(model)
输出:
null device
          1
Loading required package: methods
Loading required package: grid
Loading required package: mvtnorm
Loading required package: modeltools
Loading required package: stats4
Loading required package: strucchange
Loading required package: zoo

Attaching package: ‘zoo’

The following objects are masked from ‘package:base’:

   as.Date, as.Date.numeric

Loading required package: sandwich
朴素贝叶斯分类器
朴素贝叶斯分类是一种使用概率方法的通用分类方法,因此也称为基于贝叶斯定理的概率方法,假设特征之间是独立的。该模型在训练数据集上进行训练,以通过predict()函数进行预测。
公式:
P(A|B)=P(B|A)×P(A)P(B)它是机器学习方法中的一种示例方法,但在某些情况下可能很有用。训练既简单又快速,只需要分别考虑每个类中的每个预测器。
应用:
它通常用于情感分析。
Python3
library(caret)
## Warning: package 'caret' was built under R version 3.4.3
set.seed(7267166)
trainIndex = createDataPartition(mydata$prog, p = 0.7)$Resample1
train = mydata[trainIndex, ]
test = mydata[-trainIndex, ]

## check the balance
print(table(mydata$prog))
##
## academic    general vocational
## 105         45         50
print(table(train$prog))
输出:
## Naive Bayes Classifier for Discrete Predictors
##
## Call:
## naiveBayes.default(x = X, y = Y, laplace = laplace)
##
## A-priori probabilities:
## Y
##   academic    general vocational
##  0.5248227  0.2269504  0.2482270
##
## Conditional probabilities:
##             science
## Y                [, 1]     [, 2]
##   academic   54.21622 9.360761
##   general    52.18750 8.847954
##   vocational 47.31429 9.969871
##
##             socst
## Y                [, 1]      [, 2]
##   academic   56.58108  9.635845
##   general    51.12500  8.377196
##   vocational 44.82857 10.279865
K-NN 分类器
另一个使用的分类器是 K-NN 分类器。在模式识别中,k-最近邻算法(k-NN)是一种非参数方法,通常用于分类和回归。在这两种情况下,输入都包含特征空间中最接近的 k 个训练样本。在 k-NN 分类中,输出是一个类成员。
应用:
用于各种应用,例如经济预测、数据压缩和遗传学。
例子:
Python3
# Write Python3 code here
import numpy as np
import pandas as pd
from matplotlib import pyplot as plt
from sklearn.datasets import load_breast_cancer
from sklearn.metrics import confusion_matrix
from sklearn.neighbors import KNeighborsClassifier
from sklearn.model_selection import train_test_split
import seaborn as sns
sns.set()
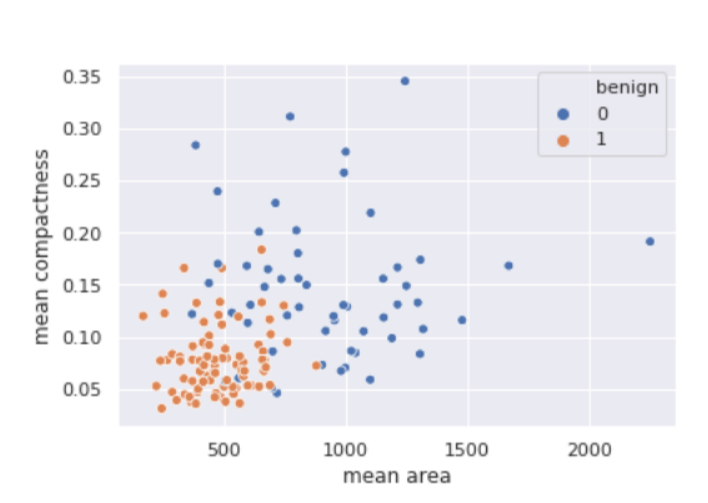
breast_cancer = load_breast_cancer()
X = pd.DataFrame(breast_cancer.data, columns = breast_cancer.feature_names)
X = X[['mean area', 'mean compactness']]
y = pd.Categorical.from_codes(breast_cancer.target, breast_cancer.target_names)
y = pd.get_dummies(y, drop_first = True)
X_train, X_test, y_train, y_test = train_test_split(X, y, random_state = 1)
sns.scatterplot(
x ='mean area',
y ='mean compactness',
hue ='benign',
data = X_test.join(y_test, how ='outer')
)
输出:
支持向量机(SVM)
支持向量机 (SVM) 是一种有监督的二进制机器学习算法,它使用分类算法来解决两组分类问题。在为每个类别提供一组带标签的训练数据的 SVM 模型后,他们能够对新文本进行分类。
SVM主要用于文本分类问题。它对看不见的数据进行分类。它比朴素贝叶斯被广泛使用。SVM id 通常是一种快速可靠的分类算法,在有限的数据量下表现非常好。
应用:
SVM 在生物信息学、基因分类等多个领域有许多应用。
例子:
Python3
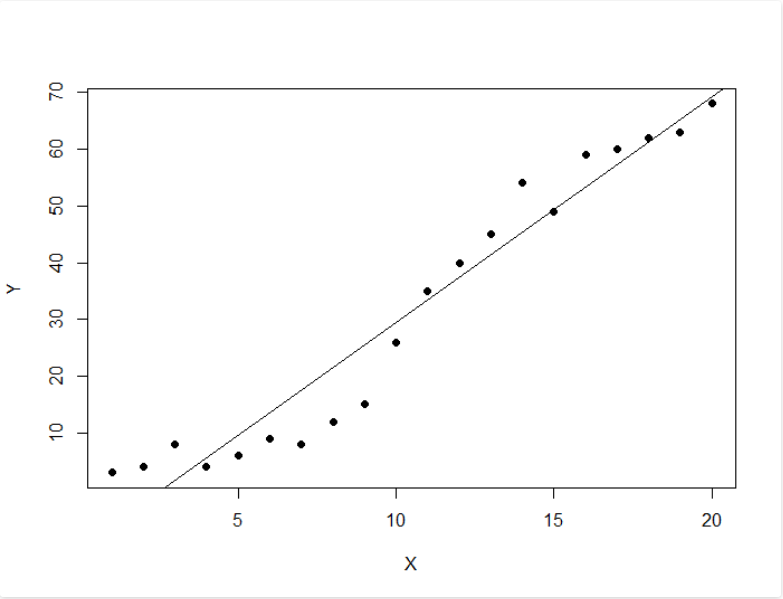
# Load the data from the csv file
dataDirectory <- "D:/" # put your own folder here
data <- read.csv(paste(dataDirectory, 'regression.csv', sep =""), header = TRUE)

# Plot the data
plot(data, pch = 16)

# Create a linear regression model
model <- lm(Y ~ X, data)

# Add the fitted line
abline(model)
输出: