📌 相关文章
- Python中的 numpy.geomspace()(1)
- Python中的numpy.geomspace(1)
- Python -Numpy
- numpy 的 - Python (1)
- Python -Numpy(1)
- Python Numpy(1)
- Python Numpy
- numpy 示例 - Python (1)
- numpy 的 - Python 代码示例
- python numpy 数组 - Python (1)
- Python中的NumPy数组
- numpy 空数组 - Python (1)
- numpy 子数组 python (1)
- numpy 数组 [-1] - Python (1)
- Python中的NumPy数组(1)
- python numpy 数组 - Python 代码示例
- numpy 示例 - Python 代码示例
- 从 numpy 到列表 python (1)
- Python| numpy numpy.matrix.H()(1)
- Python| numpy numpy.matrix.A()(1)
- Python| numpy numpy.matrix.A()
- Python| numpy numpy.matrix.T()(1)
- Python| numpy numpy.matrix.H()
- Python| numpy numpy.matrix.T()
- 安装 numpy - Python (1)
- numpy 数组 [-1] - Python 代码示例
- numpy 空数组 - Python 代码示例
- numpy 子数组 python 代码示例
- 什么是 numpy - Python (1)
📜 Python中的numpy.geomspace
📅 最后修改于: 2020-06-05 00:50:33 🧑 作者: Mango
numpy.geomspace() 用于返回以对数刻度(几何级数)均匀间隔的数字。
这类似于numpy.logspace()但直接指定了端点。每个输出样本是前一个样本的恒定倍数。
语法:
numpy.geomspace(start, stop, num=50, endpoint=True, dtype=None)
参数:
start: [scalar]序列的起始值。
stop: [scalar]序列的最终值,除非端点为False。在这种情况下,num + 1个值在log-space的间隔中间隔开,返回除最后一个(长度为num的序列)以外的所有值。
num: [整数,可选]要生成的样本数。默认值为50。endpoint
: [布尔值,可选]如果为true,则stop是最后一个样本。否则,不包括在内。默认值为True。
dtype: [dtype]输出数组的类型。如果未给出dtype,则从其他输入参数推断数据类型。
返回值:
样本: [ndarray] num个样本,以对数刻度均匀分布。
代码1:工作
# Python3 Program demonstrate
# numpy.geomspace() function

import numpy as geek


print("B\n", geek.geomspace(2.0, 3.0, num = 5), "\n")

# To evaluate sin() in long range
point = geek.geomspace(1, 2, 10)
print("A\n", geek.sin(point))
输出:
B
[2. 2.21336384 2.44948974 2.71080601 3.]
A
[0.84147098 0.88198596 0.91939085 0.95206619 0.9780296 0.9948976
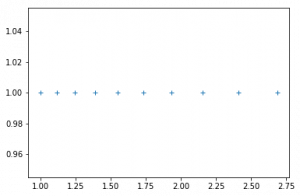
0.99986214 0.98969411 0.96079161 0.90929743]代码2:numpy.geomspace()的图形表示
# Graphical Represenation of numpy.geomspace()
import numpy as geek
import pylab as p
% matplotlib inline

# Start = 1
# End = 3

# Samples to generate = 10
x1 = geek.geomspace(1, 3, 10, endpoint = False)
y1 = geek.ones(10)

p.plot(x1, y1, '+')
输出: