将操作应用于 Pandas 中的组
先决条件:熊猫
Pandas 是一个用于数据分析和数据操作的Python库。通常数据分析需要将数据分成组以对这些组执行各种操作。 Pandas 中的 GroupBy函数采用 split-apply-combine 策略,这意味着它执行组合 - 拆分对象,将函数应用于对象并组合结果。在本文中,我们将使用groupby()函数对分组数据执行各种操作。
聚合
聚合涉及使用诸如均值、中值、众数、最小值(最小值)、最大值(最大值)、标准差(标准差)、无功(方差)、总和、计数等方法创建数据的统计汇总。团体:
- 导入模块
- 创建或加载数据
- 创建一个 GroupBy 对象,该对象沿一个键或多个键对数据进行分组
- 应用统计操作。
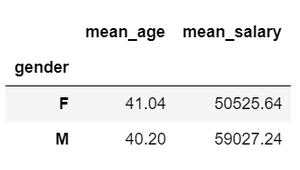
示例 1:计算男性和女性组的平均工资和年龄。它给出数字列的平均值并为列名添加前缀。
Python3
# Import required libraries
import pandas as pd
import numpy as np

# Create a sample dataframe
df = pd.DataFrame({"dept": np.random.choice(["IT", "HR", "Sales", "Production"], size=50),
                   "gender": np.random.choice(["F", "M"], size=50),
                   "age": np.random.randint(22, 60, size=50),
                   "salary": np.random.randint(20000, 90000, size=50)})
df.index.name = "emp_id"

# Calculate mean data of gender groups
df.groupby('gender').mean().add_prefix('mean_')
Python3
# Import required libraries
import pandas as pd
import numpy as np

# Create a sample dataframe
df = pd.DataFrame({"dept": np.random.choice(["IT", "HR", "Sales", "Production"], size=50),
                   "gender": np.random.choice(["F", "M"], size=50),
                   "age": np.random.randint(22, 60, size=50),
                   "salary": np.random.randint(20000, 90000, size=50)})
df.index.name = "emp_id"

# Calculate min, max, mean and count of salaries
# in different departments for males and females
df.groupby(['dept', 'gender'])['salary'].agg(["min", "max", "mean", "count"])
Python3
# Import required libraries
import pandas as pd
import numpy as np

# Create a sample dataframe
df = pd.DataFrame({"dept": np.random.choice(["IT", "HR", "Sales", "Production"], size=50),
                   "gender": np.random.choice(["F", "M"], size=50),
                   "age": np.random.randint(22, 60, size=50),
                   "salary": np.random.randint(20000, 90000, size=50)})
df.index.name = "emp_id"

# Calculate mean salaries and min-max age of employees
# in different departments for gender groups
df.groupby(['dept', 'gender']).agg({'salary': 'mean', 'age': ['min', 'max']})
Python3
# Import required libraries
import pandas as pd
import numpy as np

# Create a sample dataframe
df = pd.DataFrame({"dept": np.random.choice(["IT", "HR", "Sales", "Production"], size=50),
                   "gender": np.random.choice(["F", "M"], size=50),
                   "age": np.random.randint(22, 60, size=50),
                   "salary": np.random.randint(20000, 90000, size=50)})
df.index.name = "emp_id"

# Statistics of employee age grouped by departments
df["age"].groupby(df['dept']).describe()
Python3
# Import required libraries
import pandas as pd
import numpy as np

# Create a sample dataframe
df = pd.DataFrame({"dept": np.random.choice(["IT", "HR", "Sales", "Production"], size=50),
                   "gender": np.random.choice(["F", "M"], size=50),
                   "age": np.random.randint(22, 60, size=50),
                   "salary": np.random.randint(20000, 90000, size=50)})
df.index.name = "emp_id"

# Create bin intervals
bins = [20, 30, 45, 60]

# Segregate ages into bins of age groups
df['categories'] = pd.cut(df['age'], bins,
                          labels=['Young', 'Middle', 'Old'])

# Calculate number of obervations in each age category
df['age'].groupby(df['categories']).count()
Python3
# Import required libraries
import pandas as pd
import numpy as np

# Create a sample dataframe
df = pd.DataFrame({"dept": np.random.choice(["IT", "HR", "Sales", "Production"], size=50),
                   "gender": np.random.choice(["F", "M"], size=50),
                   "age": np.random.randint(22, 60, size=50),
                   "salary": np.random.randint(20000, 90000, size=50)})
df.index.name = "emp_id"

# Calculate mean difference by transforming each salary value
df['mean_sal_diff'] = df['salary'].groupby(
    df['dept']).transform(lambda x: x - x.mean())
df.head()
输出:
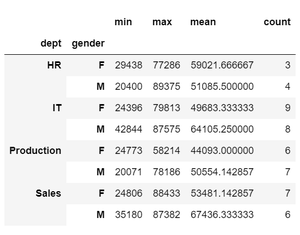
示例 2:使用接受字符串、函数或函数列表的聚合函数( DataFrameGroupBy.agg ) 执行多个聚合操作。
蟒蛇3
# Import required libraries
import pandas as pd
import numpy as np

# Create a sample dataframe
df = pd.DataFrame({"dept": np.random.choice(["IT", "HR", "Sales", "Production"], size=50),
                   "gender": np.random.choice(["F", "M"], size=50),
                   "age": np.random.randint(22, 60, size=50),
                   "salary": np.random.randint(20000, 90000, size=50)})
df.index.name = "emp_id"

# Calculate min, max, mean and count of salaries
# in different departments for males and females
df.groupby(['dept', 'gender'])['salary'].agg(["min", "max", "mean", "count"])
输出:
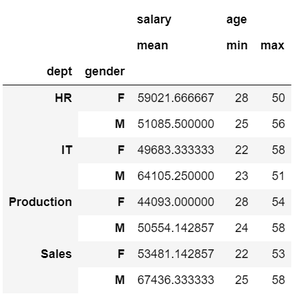
示例 3:指定多列及其对应的聚合操作如下。
蟒蛇3
# Import required libraries
import pandas as pd
import numpy as np

# Create a sample dataframe
df = pd.DataFrame({"dept": np.random.choice(["IT", "HR", "Sales", "Production"], size=50),
                   "gender": np.random.choice(["F", "M"], size=50),
                   "age": np.random.randint(22, 60, size=50),
                   "salary": np.random.randint(20000, 90000, size=50)})
df.index.name = "emp_id"

# Calculate mean salaries and min-max age of employees
# in different departments for gender groups
df.groupby(['dept', 'gender']).agg({'salary': 'mean', 'age': ['min', 'max']})
输出:
示例 4:显示任何组的通用统计信息。
蟒蛇3
# Import required libraries
import pandas as pd
import numpy as np

# Create a sample dataframe
df = pd.DataFrame({"dept": np.random.choice(["IT", "HR", "Sales", "Production"], size=50),
                   "gender": np.random.choice(["F", "M"], size=50),
                   "age": np.random.randint(22, 60, size=50),
                   "salary": np.random.randint(20000, 90000, size=50)})
df.index.name = "emp_id"

# Statistics of employee age grouped by departments
df["age"].groupby(df['dept']).describe()
输出:

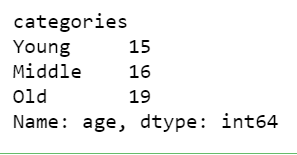
创建箱或组并应用操作
Pandas 的 cut 方法将值按 bin 间隔排序,从而创建组或类别。然后可以对这些组执行聚合或其他功能。其实现如下所示:
示例:年龄分为年龄范围,并计算样本数据中的观察计数。
蟒蛇3
# Import required libraries
import pandas as pd
import numpy as np

# Create a sample dataframe
df = pd.DataFrame({"dept": np.random.choice(["IT", "HR", "Sales", "Production"], size=50),
                   "gender": np.random.choice(["F", "M"], size=50),
                   "age": np.random.randint(22, 60, size=50),
                   "salary": np.random.randint(20000, 90000, size=50)})
df.index.name = "emp_id"

# Create bin intervals
bins = [20, 30, 45, 60]

# Segregate ages into bins of age groups
df['categories'] = pd.cut(df['age'], bins,
                          labels=['Young', 'Middle', 'Old'])

# Calculate number of obervations in each age category
df['age'].groupby(df['categories']).count()
输出:
转型
转换正在执行特定于组的操作,其中更改单个值而数据的形状保持不变。我们使用 transform()函数来做到这一点。
例子 :
蟒蛇3
# Import required libraries
import pandas as pd
import numpy as np

# Create a sample dataframe
df = pd.DataFrame({"dept": np.random.choice(["IT", "HR", "Sales", "Production"], size=50),
                   "gender": np.random.choice(["F", "M"], size=50),
                   "age": np.random.randint(22, 60, size=50),
                   "salary": np.random.randint(20000, 90000, size=50)})
df.index.name = "emp_id"

# Calculate mean difference by transforming each salary value
df['mean_sal_diff'] = df['salary'].groupby(
    df['dept']).transform(lambda x: x - x.mean())
df.head()
输出:
