在 Matplotlib 中使子图跨越多个网格行和列
在本文中,我们将讨论如何使用matplotlib模块使子图跨越多个网格行和列。
对于Python中的表示, matplotlib库长期以来一直是主力。即使在具有更简单代码界面和更敏捷的对手以及诸如seaborn、plotly、bokeh等能力的出现之后,它仍然保持着自己的地位。尽管Matplotlib可能缺乏小手的直觉能力,但它在探索性信息分析 (EDA) 中发挥了想象我们的信息调查任务的作用。
在 EDA 期间,人们可能会遇到需要展示相关情节的集合作为更大图景的组成部分的情况,以便将我们的知识带回家。 matplotlib的子图容量为我们处理工作。尽管如此,在特定情况下,我们可能需要加入一些子图,并且每个子图需要具有独特的角度比例。
首先,导入matplotlib模块的gridspec子模块。
Python3
# import modules
import matplotlib.pyplot as plt
from matplotlib.gridspec import GridSpec

# create objects
fig = plt.figure()
gs = GridSpec(4, 4, figure=fig)
Python3
# explictit function to hide index
# of subplots in the figure
def formatAxes(fig):
    for i, ax in enumerate(fig.axes):
        ax.text(0.5, 0.5, "ax%d" % (i+1), va="center", ha="center")
        ax.tick_params(labelbottom=False, labelleft=False)


# import required modules
import matplotlib.pyplot as plt
from matplotlib.gridspec import GridSpec

# create objects
fig = plt.figure(constrained_layout=True)
gs = GridSpec(3, 3, figure=fig)

# create sub plots as grid
ax1 = fig.add_subplot(gs[0, :])
ax2 = fig.add_subplot(gs[1, :-1])
ax3 = fig.add_subplot(gs[1, : -1])
ax4 = fig.add_subplot(gs[-1, 0])
ax5 = fig.add_subplot(gs[-1, -2])

# depict illustartion
fig.suptitle("Grid-Spec")
formatAxes(fig)
plt.show()
Python3
# explictit function to hide index
# of sub plots in the figure
def formatAxes(fig):
    for i, ax in enumerate(fig.axes):
        ax.text(0.5, 0.5, "ax%d" % (i+1), va="center", ha="center")
        ax.tick_params(labelbottom=False, labelleft=False)

# import required modules
import matplotlib.pyplot as plt
from matplotlib.gridspec import GridSpec

# create objects
fig = plt.figure(constrained_layout=True)
gs = GridSpec(3, 3, figure=fig)

# create sub plots as grid
ax1 = fig.add_subplot(gs[0, :])
ax2 = fig.add_subplot(gs[1, :-1])
ax3 = fig.add_subplot(gs[1:, -1])
ax4 = fig.add_subplot(gs[-1, 0])
ax5 = fig.add_subplot(gs[-1, -2])

# depict illustration
fig.suptitle("GridSpec")
formatAxes(fig)
plt.show()
Python3
# import required modules
import matplotlib.pyplot as plt
from matplotlib.gridspec import GridSpec

# create objects
fig, axes = plt.subplots(ncols=3, nrows=3,)
gs = axes[1, 2].get_gridspec()

# create sub plots as grid
for ax in axes[1:, -1]:
    ax.remove()
axsbig = fig.add_subplot(gs[1:, -1])
axsbig.annotate('Big Axes \nGridSpec[1:, -1]',
                (0.1, 0.5),
                xycoords='axes fraction',
                va='center', color="g")

# depict illustartion
fig.tight_layout()
plt.show()
Python3
# import required modules
import matplotlib.pyplot as plt
from matplotlib.gridspec import GridSpec

# create objects
fig = plt.figure()
gridspan = fig.add_gridspec(2, 2)

# create sub plots as grid
ax1 = fig.add_subplot(gs[0, 0])
ax2 = fig.add_subplot(gs[1, 0])
ax3 = fig.add_subplot(gs[:, -1])

# depict illustartion
plt.show()
Python3
# Import libraries
import numpy as np
import matplotlib.pyplot as plt

# Create a 2x2 grid of plots
fig, axes = plt.subplots(2, 2, constrained_layout=True)
a = np.linspace(0, 1)

# Modify top-left plot
axes[0,0].set_title("Top--Left", color="g")
axes[0,0].plot(x, x)

# Modify top-right plot
axes[0,1].set_title("Top--Right", color="r")
axes[0,1].plot(x, x**2)

# Modify bottom-left plot
axes[1,0].set_title("Bottom--Left", color="b")
axes[1,0].plot(x, np.sin(3*x))

# Modify bottom-right plot
axes[1,1].set_title("Bottom--Right")
axes[1,1].plot(x, 1/(1+x))

# Depict illustration
plt.show()我们首先需要创建一个GridSpec对象,它允许我们在图形对象旁边将线和段的绝对数量指示为一般图形中的争用。
我们将GridSpec对象存储在一个名为gs的变量中,并指示我们需要在一般图中有 4 条线和 4 段。
下面是一些使子图跨越多个网格行和列的程序:
示例 1:
蟒蛇3
# explictit function to hide index
# of subplots in the figure
def formatAxes(fig):
    for i, ax in enumerate(fig.axes):
        ax.text(0.5, 0.5, "ax%d" % (i+1), va="center", ha="center")
        ax.tick_params(labelbottom=False, labelleft=False)


# import required modules
import matplotlib.pyplot as plt
from matplotlib.gridspec import GridSpec

# create objects
fig = plt.figure(constrained_layout=True)
gs = GridSpec(3, 3, figure=fig)

# create sub plots as grid
ax1 = fig.add_subplot(gs[0, :])
ax2 = fig.add_subplot(gs[1, :-1])
ax3 = fig.add_subplot(gs[1, : -1])
ax4 = fig.add_subplot(gs[-1, 0])
ax5 = fig.add_subplot(gs[-1, -2])

# depict illustartion
fig.suptitle("Grid-Spec")
formatAxes(fig)
plt.show()
输出:

目前,我们需要确定每个子图如何遍历一般图形中的线和段的微妙之处。重要的是在纸上绘制草图,说明您需要如何展开子图,以免它们覆盖。完成后,我们通过我们创建的GridSpec对象传递这些数据。行/段长度信息在类似的列表文档中传递,我们使用从零开始的行和段列表编号对展品/数据帧进行子集化,并使用“ :”来指示范围。带有文件的GridSpec对象被传递给图形对象的add_subplot容量。
我们为该图添加了一个通用标题并消除了勾号以更好地设想格式,因为这里的目标是展示我们如何完成分布在不同线/段上的子图。当您实现这一点时,很明显,您需要从数据框中添加枢轴刻度、名称等,并更改分割和图形大小以强制这些绘图组件。
示例 2:
在这里,我们创建了一个显式函数来格式化图形的轴,即隐藏子图的索引值。
蟒蛇3
# explictit function to hide index
# of sub plots in the figure
def formatAxes(fig):
    for i, ax in enumerate(fig.axes):
        ax.text(0.5, 0.5, "ax%d" % (i+1), va="center", ha="center")
        ax.tick_params(labelbottom=False, labelleft=False)

# import required modules
import matplotlib.pyplot as plt
from matplotlib.gridspec import GridSpec

# create objects
fig = plt.figure(constrained_layout=True)
gs = GridSpec(3, 3, figure=fig)

# create sub plots as grid
ax1 = fig.add_subplot(gs[0, :])
ax2 = fig.add_subplot(gs[1, :-1])
ax3 = fig.add_subplot(gs[1:, -1])
ax4 = fig.add_subplot(gs[-1, 0])
ax5 = fig.add_subplot(gs[-1, -2])

# depict illustration
fig.suptitle("GridSpec")
formatAxes(fig)
plt.show()
输出:
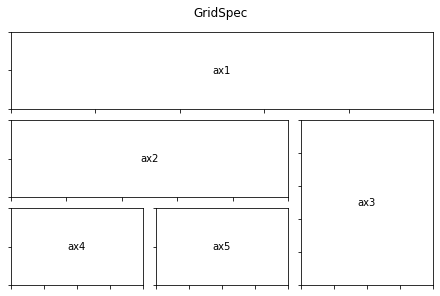
这可能被证明在多变量时间排列图中很有用,我们可能需要在顶部列中显示延伸到各个部分的时间排列图,并在下面的其他子图中显示其他单变量、多变量感知。您可以通过在一般图形和各个子图的范围中指示您的线条/部分来调整拼图的外观。
示例 3:
使用 subplots 和GridSpec组合两个子图,这里我们需要以使用子图制作的战斧格式合并两个子图。我们可以从战斧获得 GridSpec,然后消除覆盖的战斧并用另一个更大的战斧填补空洞。这里我们制作了一个格式,将最后一节中的最后两个战斧加入。
另请参阅使用 GridSpec 和不同容量修改图格式。
蟒蛇3
# import required modules
import matplotlib.pyplot as plt
from matplotlib.gridspec import GridSpec

# create objects
fig, axes = plt.subplots(ncols=3, nrows=3,)
gs = axes[1, 2].get_gridspec()

# create sub plots as grid
for ax in axes[1:, -1]:
    ax.remove()
axsbig = fig.add_subplot(gs[1:, -1])
axsbig.annotate('Big Axes \nGridSpec[1:, -1]',
                (0.1, 0.5),
                xycoords='axes fraction',
                va='center', color="g")

# depict illustartion
fig.tight_layout()
plt.show()
输出:

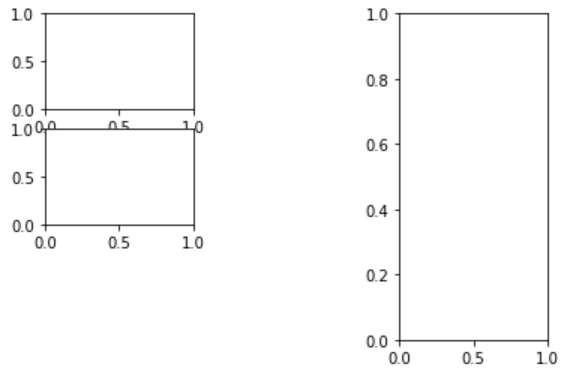
示例 4:
在这个例子中,我们将添加一个跨越两行的子图。
蟒蛇3
# import required modules
import matplotlib.pyplot as plt
from matplotlib.gridspec import GridSpec

# create objects
fig = plt.figure()
gridspan = fig.add_gridspec(2, 2)

# create sub plots as grid
ax1 = fig.add_subplot(gs[0, 0])
ax2 = fig.add_subplot(gs[1, 0])
ax3 = fig.add_subplot(gs[:, -1])

# depict illustartion
plt.show()
输出:
示例 5:
在这里,我们通过在插图的不同网格中描绘各种图形来说明子图的应用。
蟒蛇3
# Import libraries
import numpy as np
import matplotlib.pyplot as plt

# Create a 2x2 grid of plots
fig, axes = plt.subplots(2, 2, constrained_layout=True)
a = np.linspace(0, 1)

# Modify top-left plot
axes[0,0].set_title("Top--Left", color="g")
axes[0,0].plot(x, x)

# Modify top-right plot
axes[0,1].set_title("Top--Right", color="r")
axes[0,1].plot(x, x**2)

# Modify bottom-left plot
axes[1,0].set_title("Bottom--Left", color="b")
axes[1,0].plot(x, np.sin(3*x))

# Modify bottom-right plot
axes[1,1].set_title("Bottom--Right")
axes[1,1].plot(x, 1/(1+x))

# Depict illustration
plt.show()
输出:
