- Python numpy.random()(1)
- Python中的 numpy.random.f()
- numpy random - Python (1)
- numpy random - Python 代码示例
- numpy random int - Python (1)
- numpy random int - Python 代码示例
- Python中的 numpy.random.power()(1)
- Python中的 numpy.random.power()
- python random - Python (1)
- c++ random - C++ (1)
- python random - Python 代码示例
- Python中的 numpy.random.permutation()
- Python中的 numpy.random.permutation()(1)
- Python中的numpy.random.shuffle()
- Python中的numpy.random.shuffle()(1)
- Python中的numpy.random.rand(1)
- Python中的 numpy.random.rand()(1)
- Python中的numpy.random.rand
- Python中的 numpy.random.rand()
- Python中的 numpy.random.gamma()
- Python中的 numpy.random.gamma()(1)
- c++ random - C++ 代码示例
- Python中的 numpy.random.uniform()(1)
- Python中的 numpy.random.uniform()
- Python中的 numpy.random.standard_t()
- Python中的 numpy.random.standard_t()(1)
- Python中的 numpy.random.logistic()(1)
- Python中的 numpy.random.logistic()
- Python中的 numpy.random.choice()
📅 最后修改于: 2020-10-27 04:11:24 🧑 作者: Mango
Python的numpy.random()
随机数是NumPy库中存在的模块。该模块包含用于生成随机数的功能。该模块包含一些简单的随机数据生成方法,一些排列和分布函数以及随机生成器函数。
随机模块中的所有功能如下:
简单随机数据
简单随机数据具有以下功能:
1)p.random.rand(d0,d1,…,dn)
随机模块的此函数用于生成给定形状的随机数或值。
例:
import numpy as np
a=np.random.rand(5,2)
a
输出:
array([[0.74710182, 0.13306399],
           [0.01463718, 0.47618842],
           [0.98980426, 0.48390004],
           [0.58661785, 0.62895758],
           [0.38432729, 0.90384119]])
2)np.random.randn(d0,d1,…,dn)
随机模块的此函数从“标准正态”分布返回样本。
例:
import numpy as np
a=np.random.randn(2,2)
a
输出:
array([[ 1.43327469, -0.02019121],
       [ 1.54626422,  1.05831067]])
b=np.random.randn()
b
-0.3080190768904835
3)np.random.randint(low [,high,size,dtype])
random模块的此函数用于生成从inclusive(低)到exclusive(高)的随机整数。
例:
import numpy as np
a=np.random.randint(3, size=10)
a
输出:
array([1, 1, 1, 2, 0, 0, 0, 0, 0, 0])
4)np.random.random_integers(low [,high,size])
随机模块的此函数用于生成介于低和高之间的np.int类型的随机整数。
例:
import numpy as np
a=np.random.random_integers(3)
a
b=type(np.random.random_integers(3))
b
c=np.random.random_integers(5, size=(3,2))
c
输出:
2

array([[1, 1],
           [2, 5],
           [1, 3]])
5)np.random.random_sample([size])
随机模块的此函数用于在半开间隔[0.0,1.0)中生成随机浮点数。
例:
import numpy as np
a=np.random.random_sample()
a
b=type(np.random.random_sample())
b
c=np.random.random_sample((5,))
c
输出:
0.09250360565571492

array([0.34665418, 0.47027209, 0.75944969, 0.37991244, 0.14159746])
6)np.random.random([size])
随机模块的此函数用于在半开间隔[0.0,1.0)中生成随机浮点数。
例:
import numpy as np
a=np.random.random()
a
b=type(np.random.random())
b
c=np.random.random((5,))
c
输出:
0.008786953974334155

array([0.05530122, 0.59133394, 0.17258794, 0.6912388 , 0.33412534])
7)np.random.ranf([size])
随机模块的此函数用于在半开间隔[0.0,1.0)中生成随机浮点数。
例:
import numpy as np
a=np.random.ranf()
a
b=type(np.random.ranf())
b
c=np.random.ranf((5,))
c
输出:
0.2907792098474542

array([0.34084881, 0.07268237, 0.38161256, 0.46494681, 0.88071377])
8)np.random.sample([size])
随机模块的此函数用于在半开间隔[0.0,1.0)中生成随机浮点数。
例:
import numpy as np
a=np.random.sample()
a
b=type(np.random.sample())
b
c=np.random.sample((5,))
c
输出:
0.012298209913766511

array([0.71878544, 0.11486169, 0.38189074, 0.14303308, 0.07217287])
9)np.random.choice(a [,size,replace,p])
随机模块的此函数用于从给定的一维数组生成随机样本。
例:
import numpy as np
a=np.random.choice(5,3)
a
b=np.random.choice(5,3, p=[0.2, 0.1, 0.4, 0.2, 0.1])
b
输出:
array([0, 3, 4])
array([2, 2, 2], dtype=int64)
10)np.random.bytes(长度)
随机模块的此函数用于生成随机字节。
例:
import numpy as np
a=np.random.bytes(7)
a
输出:
'nQ\x08\x83\xf9\xde\x8a'
排列
有以下排列功能:
1)np.random.shuffle()
此函数用于通过改组其内容就地修改序列。
例:
import numpy as np
a=np.arange(12)
a
np.random.shuffle(a)
a
输出:
array([ 0,  1,  2,  3,  4,  5,  6,  7,  8,  9, 10, 11])
array([10,  3,  2,  4,  5,  8,  0,  9,  1, 11,  7,  6])
2)np.random.permutation()
此函数随机置换序列或返回置换范围。
例:
import numpy as np
a=np.random.permutation(12)
a
输出:
array([ 8, 7, 3, 11, 6, 0, 9, 10, 2, 5, 4, 1])
发行版
有以下排列功能:
1)beta(a,b [,size])
此函数用于从Beta分布中抽取样本。
例:
def setup(self):
        self.dist = dist.beta
        self.cargs = []
        self.ckwd = dict(alpha=2, beta=3)
        self.np_rand_fxn = numpy.random.beta
        self.np_args = [2, 3]
        self.np_kwds = dict()
2)二项式(n,p [,size])
此函数用于从二项分布中抽取样本。
例:
import numpy as np
n, p = 10, .6
s1= np.random.binomial(n, p, 10)
s1
输出:
array([6, 7, 7, 9, 3, 7, 8, 6, 6, 4])
3)chisquare(df [,size])
此函数用于从二项分布中抽取样本。
例:
import numpy as np
np.random.chisquare(2,4)
sum(np.random.binomial(9, 0.1, 20000) == 0)/20000.
输出:
array([6, 7, 7, 9, 3, 7, 8, 6, 6, 4])
4)dirichlet(alpha [,size])
此函数用于从Dirichlet分布中抽取样本。
例:
Import numpy as np
import matplotlib.pyplot as plt
s1 = np.random.dirichlet((10, 5, 3), 20).transpose()
plt.barh(range(20), s1[0])
plt.barh(range(20), s1[1], left=s1[0], color='g')
plt.barh(range(20), s1[2], left=s1[0]+s1[1], color='r')
plt.title("Lengths of Strings")
plt.show()
输出:

5)指数([scale,size])
此函数用于从指数分布中提取样本。
例:
def __init__(self, sourceid, targetid):
        self.__type = 'Transaction'
        self.id = uuid4()
        self.source = sourceid
        self.target = targetid
        self.date = self._datetime.date(start=2015, end=2019)
        self.time = self._datetime.time()

        if random() < 0.05:
            self.amount = self._numbers.between(100000, 1000000)
        self.amount = npr.exponential(10)

        if random() < 0.15:
            self.currency = self._business.currency_iso_code()
        else:
            self.currency = None
6)f(dfnum,dfden [,size])
此函数用于从F分布中抽取样本。
例:
import numpy as np
dfno= 1.
dfden = 48.
s1 = np.random.f(dfno, dfden, 10)
np.sort(s1)
输出:
array([0.00264041, 0.04725478, 0.07140803, 0.19526217, 0.23979   ,
       0.24023478, 0.63141254, 0.95316446, 1.40281789, 1.68327507])
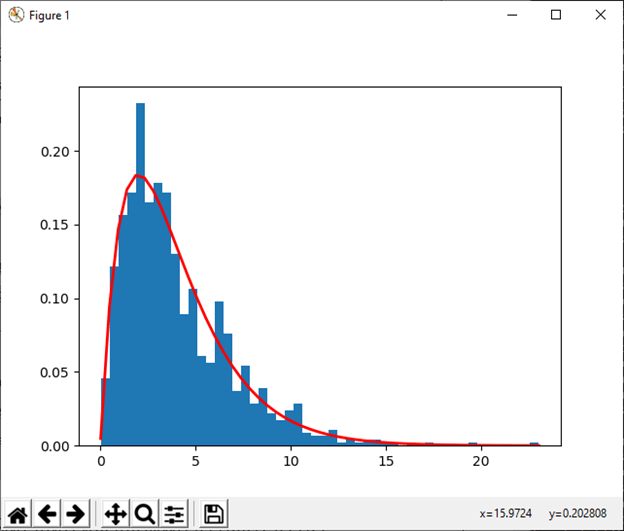
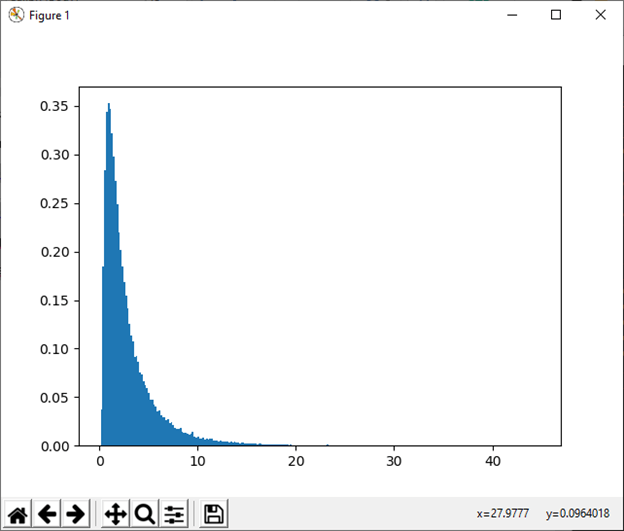
7)gamma(shape [,scale,size])
此函数用于从Gamma分布中提取样本
例:
import numpy as np
shape, scale = 2., 2.
s1 = np.random.gamma(shape, scale, 1000)
import matplotlib.pyplot as plt
import scipy.special as spss
count, bins, ignored = plt.hist(s1, 50, density=True)
a = bins**(shape-1)*(np.exp(-bins/scale) /
(spss.gamma(shape)*scale**shape))
plt.plot(bins, a, linewidth=2, color='r')
plt.show()
8)geometric(p [,size])
此函数用于从几何分布中提取样本。
例:
import numpy as np
a = np.random.geometric(p=0.35, size=10000)
(a == 1).sum() / 1000
输出:
3.
9)gumbel([位置,比例,大小])
此函数用于从Gumble分布中提取样本。
例:
import numpy as np
lov, scale = 0, 0.2
s1 = np.random.gumbel(loc, scale, 1000)
import matplotlib.pyplot as plt
count, bins, ignored = plt.hist(s1, 30, density=True)
plt.plot(bins, (1/beta)*np.exp(-(bins - loc)/beta)* np.exp( -np.exp( -(bins - loc) /beta) ),linewidth=2, color='r')
plt.show()
输出:
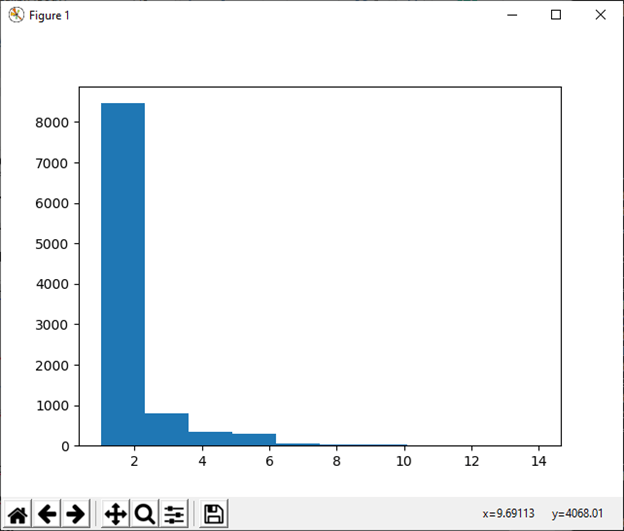
10)超几何(ngood,nbad,nsample [,size])
此函数用于从超几何分布中提取样本。
例:
import numpy as np
good, bad, samp = 100, 2, 10
s1 = np.random.hypergeometric(good, bad, samp, 1000)
plt.hist(s1)
plt.show()
输出:
(array([ 13., 0., 0., 0., 0., 163., 0., 0., 0., 824.]), array([ 8. , 8.2, 8.4, 8.6, 8.8, 9. , 9.2, 9.4, 9.6, 9.8, 10. ]), )
11)laplace([位置,比例,大小])
此函数用于从Laplace或具有指定位置和比例的双指数分布中抽取样本。
例:
import numpy as np
location, scale = 0., 2.
s = np.random.laplace(location, scale, 10)
s
输出:
array([-2.77127948, -1.46401453, -0.03723516, -1.61223942,  2.29590691,
        1.74297722,  1.49438411,  0.30325513, -0.15948891, -4.99669747])
12)后勤([位置,比例,大小])
此函数用于从逻辑分布中抽取样本。
例:
import numpy as np
import matplotlib.pyplot as plt
location, scale = 10, 1
s1 = np.random.logistic(location, scale, 10000)
count, bins, ignored = plt.hist(s1, bins=50)
count
bins
ignored
plt.show()
输出:
array([1.000e+00, 1.000e+00, 1.000e+00, 0.000e+00, 1.000e+00, 1.000e+00,
       1.000e+00, 5.000e+00, 7.000e+00, 1.100e+01, 1.800e+01, 3.500e+01,
       5.300e+01, 6.700e+01, 1.150e+02, 1.780e+02, 2.300e+02, 3.680e+02,
       4.910e+02, 6.400e+02, 8.250e+02, 9.100e+02, 9.750e+02, 1.039e+03,
       9.280e+02, 8.040e+02, 6.530e+02, 5.240e+02, 3.380e+02, 2.470e+02,
       1.650e+02, 1.150e+02, 8.500e+01, 6.400e+01, 3.300e+01, 1.600e+01,
       2.400e+01, 1.400e+01, 4.000e+00, 5.000e+00, 2.000e+00, 2.000e+00,
       1.000e+00, 1.000e+00, 0.000e+00, 1.000e+00, 0.000e+00, 0.000e+00,
       0.000e+00, 1.000e+00])
array([ 0.50643911,  0.91891814,  1.33139717,  1.7438762 ,  2.15635523,
        2.56883427,  2.9813133 ,  3.39379233,  3.80627136,  4.2187504 ,
        4.63122943,  5.04370846,  5.45618749,  5.86866652,  6.28114556,
        6.69362459,  7.10610362,  7.51858265,  7.93106169,  8.34354072,
        8.75601975,  9.16849878,  9.58097781,  9.99345685, 10.40593588,
       10.81841491, 11.23089394, 11.64337298, 12.05585201, 12.46833104,
       12.88081007, 13.2932891 , 13.70576814, 14.11824717, 14.5307262 ,
       14.94320523, 15.35568427, 15.7681633 , 16.18064233, 16.59312136,
       17.00560039, 17.41807943, 17.83055846, 18.24303749, 18.65551652,
       19.06799556, 19.48047459, 19.89295362, 20.30543265, 20.71791168,
       21.13039072])
13)对数正态([均值,sigma,大小])
此函数用于从对数正态分布中抽取样本。
例:
import numpy as np
mu, sigma = 2., 1.
s1 = np.random.lognormal(mu, sigma, 1000)
import matplotlib.pyplot as plt
count, bins, ignored = plt.hist(s1, 100, density=True, align='mid')
a = np.linspace(min(bins), max(bins), 10000)
pdf = (np.exp(-(np.log(a) - mu)**2 / (2 * sigma**2))/ (a * sigma * np.sqrt(2 * np.pi)))
plt.plot(a, pdf, linewidth=2, color='r')
plt.axis('tight')
plt.show()
输出:
14)logseries(p [,size])
此函数用于从对数分布中提取样本。
例:
import numpy as np
x = .6
s1 = np.random.logseries(x, 10000)
count, bins, ignored = plt.hist(s1)
def logseries(k, p):
return -p**k/(k*log(1-p))
plt.plot(bins, logseries(bins, x)*count.max()/logseries(bins, a).max(), 'r')
plt.show()
输出:
15)多项式(n,pvals [,size])
此函数用于从多项分布中提取样本。
例:
import numpy as np
np.random.multinomial(20, [1/6.]*6, size=1)
输出:
array([[4, 2, 5, 5, 3, 1]])
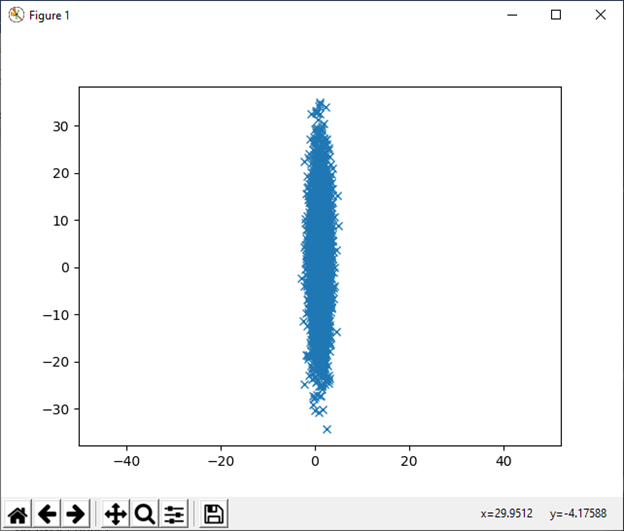
16)multivariate_normal(平均值,cov [,大小,…)
此函数用于从多元正态分布中提取样本。
例:
import numpy as np
mean = (1, 2)
coveriance = [[1, 0], [0, 100]]
import matplotlib.pyplot as plt
a, b = np.random.multivariate_normal(mean, coveriance, 5000).T
plt.plot(a, b, 'x')
plt.axis('equal'023
030
)
plt.show()
输出:
17)negative_binomial(n,p [,size])
此函数用于从负二项分布中抽取样本。
例:
import numpy as np
s1 = np.random.negative_binomial(1, 0.1, 100000)
for i in range(1, 11):
probability = sum(s1
1 wells drilled, probability of one success = 0
2 wells drilled, probability of one success = 0
3 wells drilled, probability of one success = 0
4 wells drilled, probability of one success = 0
5 wells drilled, probability of one success = 0
6 wells drilled, probability of one success = 0
7 wells drilled, probability of one success = 0
8 wells drilled, probability of one success = 0
9 wells drilled, probability of one success = 0
10 wells drilled, probability of one success = 0
18)noncentral_chisquare(df,nonc [,size])
此函数用于从非中心卡方分布中抽取样本。
例:
import numpy as np
import matplotlib.pyplot as plt
val = plt.hist(np.random.noncentral_chisquare(3, 25, 100000), bins=200, normed=True)
plt.show()
输出:
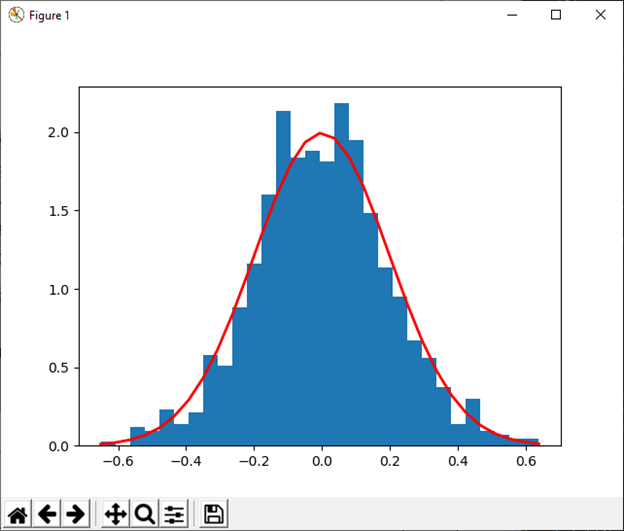
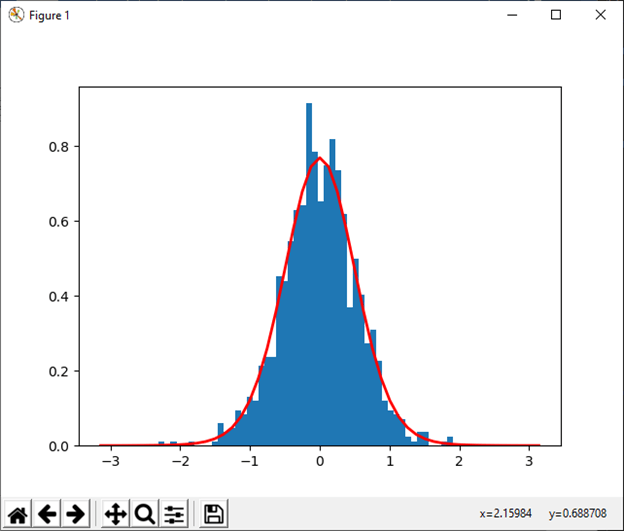
19)正常([位置,比例,大小])
此函数用于从正态分布中提取样本。
例:
import numpy as np
import matplotlib.pyplot as plt
mu, sigma = 0, 0.2 # mean and standard deviation
s1 = np.random.normal(mu, sigma, 1000)
abs(mu - np.mean(s1)) < 0.01
abs(sigma - np.std(s1, ddof=1)) < 0.01
count, bins, ignored = plt.hist(s1, 30, density=True)
plt.plot(bins, 1/(sigma * np.sqrt(2 * np.pi)) *np.exp( - (bins - mu)**2 / (2 * sigma**2) ), linewidth=2, color='r')
plt.show()
输出:
20)pareto(a [,size])
此函数用于从具有指定形状的Lomax或Pareto II提取样品。
例:
import numpy as np
import matplotlib.pyplot as plt
b, m1 = 3., 2.  # shape and mode
s1 = (np.random.pareto(b, 1000) + 1) * m1
count, bins, _ = plt.hist(s1, 100, density=True)
fit = b*m**b / bins**(b+1)
plt.plot(bins, max(count)*fit/max(fit), linewidth=2, color='r')
plt.show()
输出:
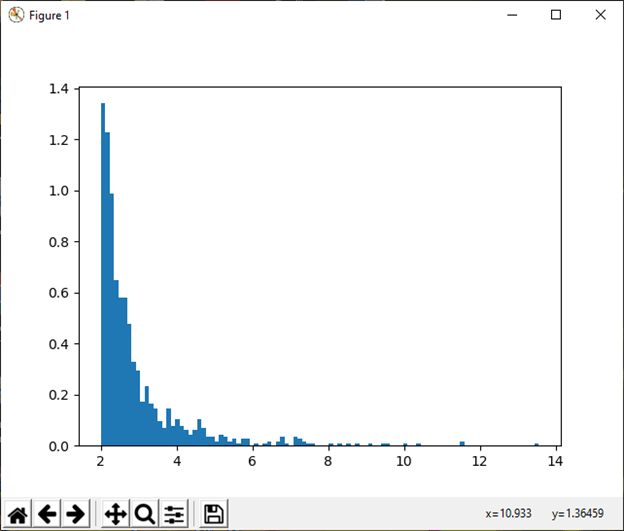
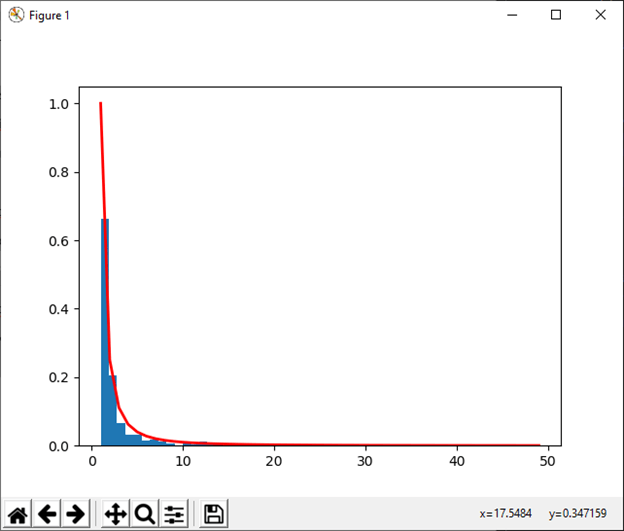
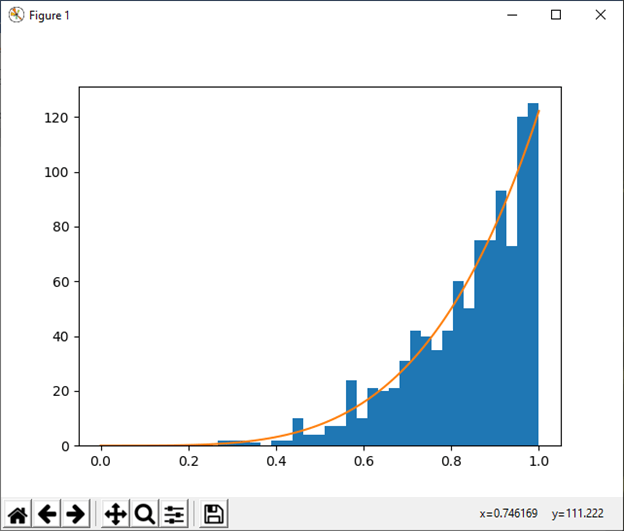
21)power(a [,size])
此函数用于从指数为a-1的幂分布中提取[0,1]中的样本。
例:
import numpy as np
x = 5. # shape
samples = 1000
s1 = np.random.power(x, samples)
import matplotlib.pyplot as plt
count, bins, ignored = plt.hist(s1, bins=30)
a = np.linspace(0, 1, 100)
b = x*a**(x-1.)
density_b = samples*np.diff(bins)[0]*b
plt.plot(a, density_b)
plt.show()
输出:
22)瑞利([scale,size])
此函数用于从瑞利分布中提取样本。
例:
val = hist(np.random.rayleigh(3, 100000), bins=200, density=True)
meanval = 1
modeval = np.sqrt(2 / np.pi) * meanval
s1 = np.random.rayleigh(modeval, 1000000)
100.*sum(s1>3)/1000000.
输出:
0.087300000000000003
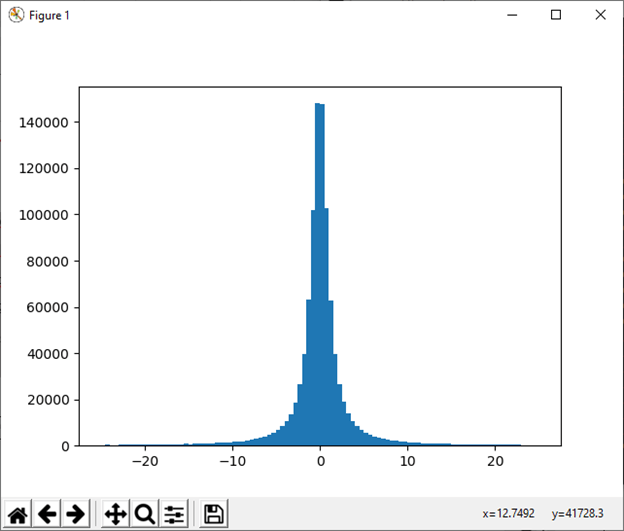
23)standard_cauchy([size])
此函数用于从模式= 0的标准柯西分布中抽取样本。
例:
import numpy as np
import matplotlib.pyplot as plt
s1 = np.random.standard_cauchy(1000000)
s1 = s1[(s1>-25) & (s1<25)]  # truncate distribution so it plots well
plt.hist(s1, bins=100)
plt.show()
输出:
24)standard_exponential([size])
此函数用于从标准指数分布中抽取样本。
例:
import numpy as np
n = np.random.standard_exponential((2, 7000))
输出:
array([[0.53857931, 0.181262  , 0.20478701, ..., 3.66232881, 1.83882709,
        1.77963295],
       [0.65163973, 1.40001955, 0.7525986 , ..., 0.76516523, 0.8400617 ,
        0.88551011]])
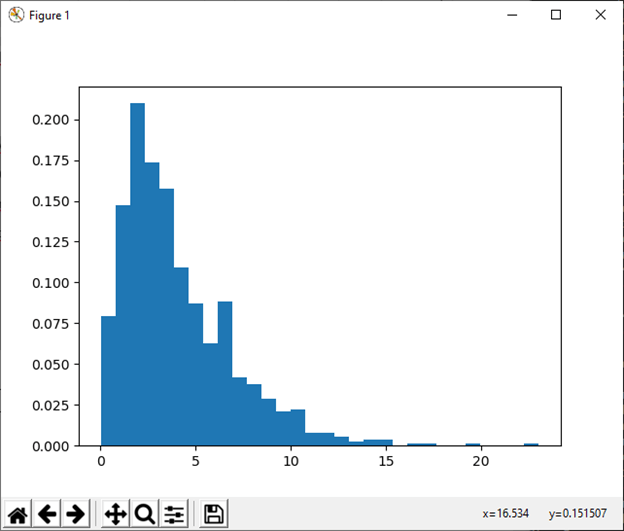
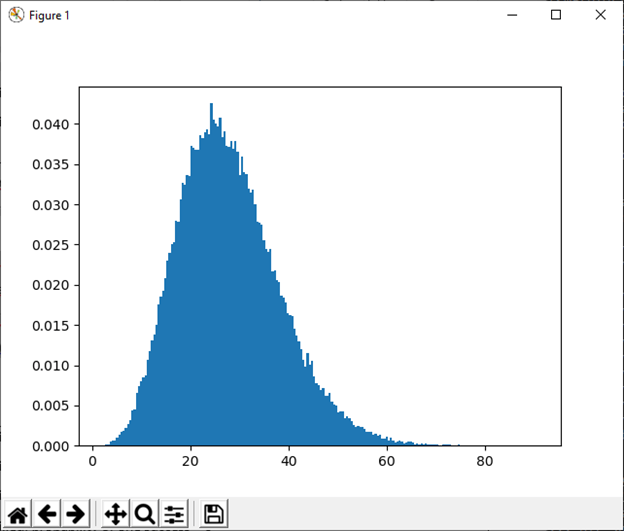
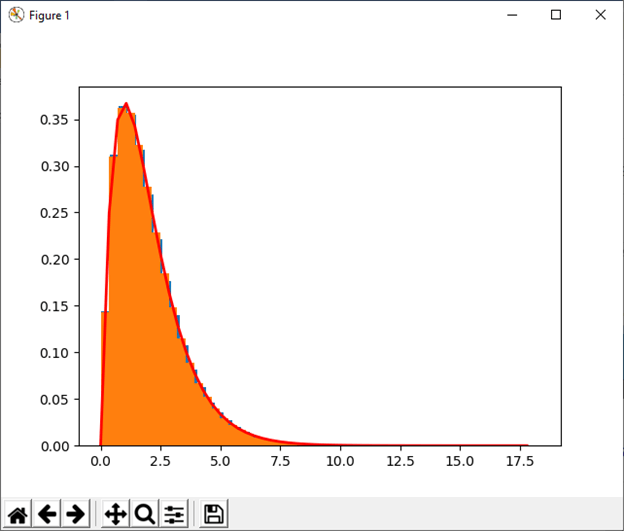
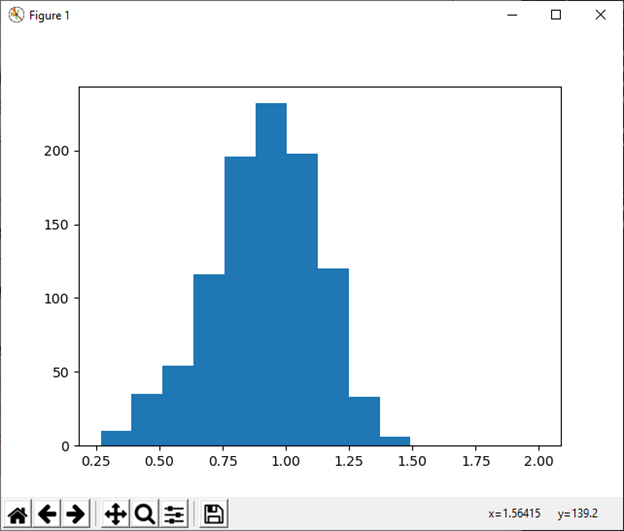
25)standard_gamma([size])
此函数用于从标准Gamma分布中提取样本。
例:
import numpy as np
shape, scale = 2., 1.
s1 = np.random.standard_gamma(shape, 1000000)
import matplotlib.pyplot as plt
import scipy.special as sps
count1, bins1, ignored1 = plt.hist(s, 50, density=True)
y = bins1**(shape-1) * ((np.exp(-bins1/scale))/ (sps.gamma(shape) * scale**shape))
plt.plot(bins1, y, linewidth=2, color='r')
plt.show()
输出:
26)standard_normal([size])
此函数用于从标准正态分布中抽取样本。
例:
import numpy as np
import matplotlib.pyplot as plt
s1= np.random.standard_normal(8000)
s1
q = np.random.standard_normal(size=(3, 4, 2))
q
输出:
array([-3.14907597,  0.95366265, -1.20100026, ...,  3.47180222,
        0.9608679 ,  0.0774319 ])
array([[[ 1.55635461, -1.29541713],
        [-1.50534663, -0.02829194],
        [ 1.03949348, -0.26128132],
        [ 1.51921798,  0.82136178]],

       [[-0.4011052 , -0.52458858],
        [-1.31803814,  0.37415379],
        [-0.67077365,  0.97447018],
        [-0.20212115,  0.67840888]],

       [[ 1.86183474,  0.19946562],
        [-0.07376021,  0.84599701],
        [-0.84341386,  0.32081667],
        [-3.32016062, -1.19029818]]])
27)standard_t(df [,size])
此函数用于以df自由度从标准Student分布中抽取样本。
例:
intake = np.array([5260., 5470, 5640, 6180, 6390, 6515, 6805, 7515,8230,8770])
s1 = np.random.standard_t(10, size=100000)
np.mean(intake)
intake.std(ddof=1)
t = (np.mean(intake)-7725)/(intake.std(ddof=1)/np.sqrt(len(intake)))
h = plt.hist(s1, bins=100, density=True)
np.sum(s1
输出:
6677.5
1174.1101831694598
0.00864
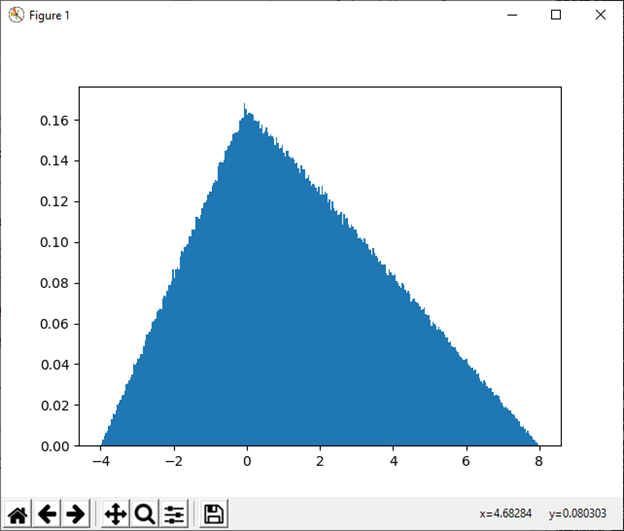
28)三角形(左,模式,右[,大小])
此函数用于从间隔内的三角形分布中抽取样本。
例:
import numpy as np
import matplotlib.pyplot as plt
h = plt.hist(np.random.triangular(-4, 0, 8, 1000000), bins=300,density=True)
plt.show()
输出:
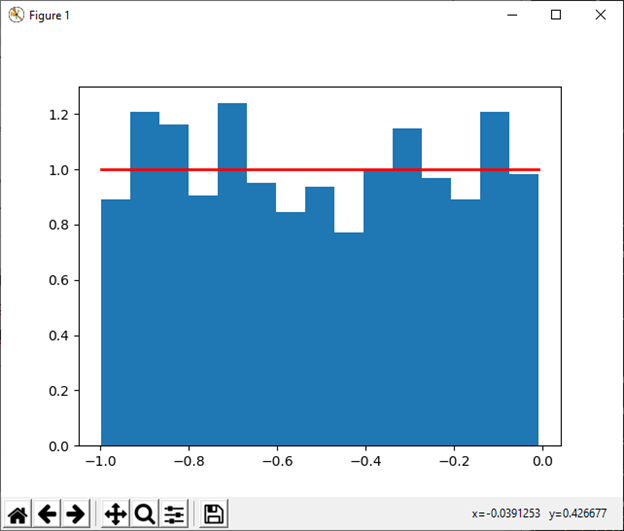
29)统一([低,高,大小])
此函数用于从均匀分布中抽取样本。
例:
import numpy as np
import matplotlib.pyplot as plt
s1 = np.random.uniform(-1,0,1000)
np.all(s1 >= -1)
np.all(s1 < 0)
count, bins, ignored = plt.hist(s1, 15, density=True)
plt.plot(bins, np.ones_like(bins), linewidth=2, color='r')
plt.show()
输出:
30)vonmises(m1,m2 [,size])
此函数用于从von Mises分布中抽取样本。
例:
import numpy as np
import matplotlib.pyplot as plt
m1, m2 = 0.0, 4.0
s1 = np.random.vonmises(m1, m2, 1000)
from scipy.special import i0
plt.hist(s1, 50, density=True)
x = np.linspace(-np.pi, np.pi, num=51)
y = np.exp(m2*np.cos(x-m1))/(2*np.pi*i0(m2))
plt.plot(x, y, linewidth=2, color='r')
plt.show()
输出:
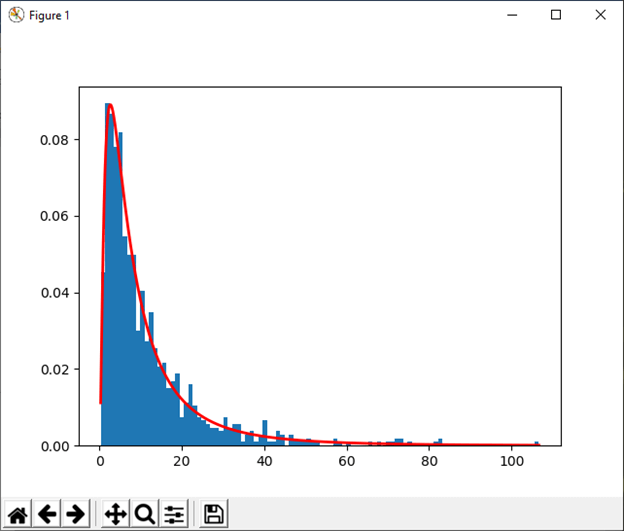
31)wald(平均值,比例尺[,大小])
此函数用于从Wald或高斯逆分布中抽取样本。
例:
import numpy as np
import matplotlib.pyplot as plt
h = plt.hist(np.random.wald(3, 3, 100000), bins=250, density=True)
plt.show()
输出:
32)weibull(a [,size])
此函数用于从Weibull分布中抽取样本。
例:
import numpy as np
import matplotlib.pyplot as plt
from scipy import special
x=2.0
s=np.random.weibull(x, 1000)
a = np.arange(1, 100.)/50.
def weib(x, n, a):
return (a/n)*(x/n)**np.exp(-(x/n)**a)
count, bins, ignored = plt.hist(np.random.weibull(5.,1000))
a= np.arange(1,100.)/50.
scale = count.max()/weib(x, 1., 5.).max()
scale = count.max()/weib(a, 1., 5.).max()
plt.plot(x, weib(x, 1., 5.)*scale)
plt.show()
输出:
33)zipf(a [,size])
此函数用于从Zipf分布中抽取样本。
例:
import numpy as np
import matplotlib.pyplot as plt
from scipy import special
x=2.0
s=np.random.zipf(x, 1000)
count, bins, ignored = plt.hist(s[s<50], 50, density=True)
a = np.arange(1., 50.)
b= a**(-x) / special.zetac(x)
plt.plot(a, b/max(b), linewidth=2, color='r')
plt.show()
输出: