在 Matplotlib 中径向位移饼图楔形
饼图是划分为代表不同数据值的切片的统计图,总和为 100%。 Python是最常用的数据可视化编程语言之一。 Python有多个数据可视化库,Matplotlib 就是其中之一。 Matplotlib 因其简单和易于实现而被广泛使用。 matplotlib 库支持饼图创建。爆炸功能允许分离饼图的切片。用户可以明确指定他们希望爆炸的部分。爆炸元组中指定的值决定了切片爆炸的距离。值越大,切片与饼图中心的距离越大。
示例 1:
在此示例中,导入了 matplotlib.pyplot 模块。大陆和面阵被初始化。定义了爆炸元组。必须拆分的切片的索引被赋予一个大于 0 的值。将切片移动到元组中指定的距离圆心的距离。饼图是针对指定数据绘制的。 autopct 属性用于指定切片中文本与圆心的距离。 startangle 用于指定图表的方向。 startangle 的默认值为 0,这意味着绘图从正 X 轴开始。边缘颜色设置为黑色,线宽设置为2。抗锯齿属性设置为true,以防止图像出现锯齿效果。
下面是实现:
Python3
import matplotlib.pyplot as plt

# the slices are ordered and
# plotted counter-clockwise:
continents = ['Asia', 'Europe', 'North America',
              'South America','Australia',
              'Africa','Antarctica']

area = [25, 20, 15, 10,15,10,5]
explode = (0.1, 0, 0.1, 0,0.1,0.1,0.1)

plt.pie(area, explode = explode, labels = continents,
        autopct = '%1.1f%%',startangle = 0,
        wedgeprops = {"edgecolor" : "black",
                    'linewidth' : 2,
                    'antialiased': True})

# Equal aspect ratio ensures
# that pie is drawn as a circle.
plt.axis('equal')

plt.show()
Python3
import matplotlib.pyplot as plt

# the slices are ordered and plotted counter-clockwise:
sales = ['Product A', 'Product B',
         'Product C', 'Product D']

profit = [20, 30, 25, 20]
explode = (0.1, 0, 0.1, 0)

plt.pie(profit, explode = explode, labels = sales,
        autopct = '%1.1f%%',shadow = True,
        startangle = 90,
        wedgeprops = {"edgecolor":"black",
                    'linewidth': 2,
                    'antialiased': True})

# Equal aspect ratio ensures
# that pie is drawn as a circle.
plt.axis('equal')

plt.show()
输出:

示例 2:
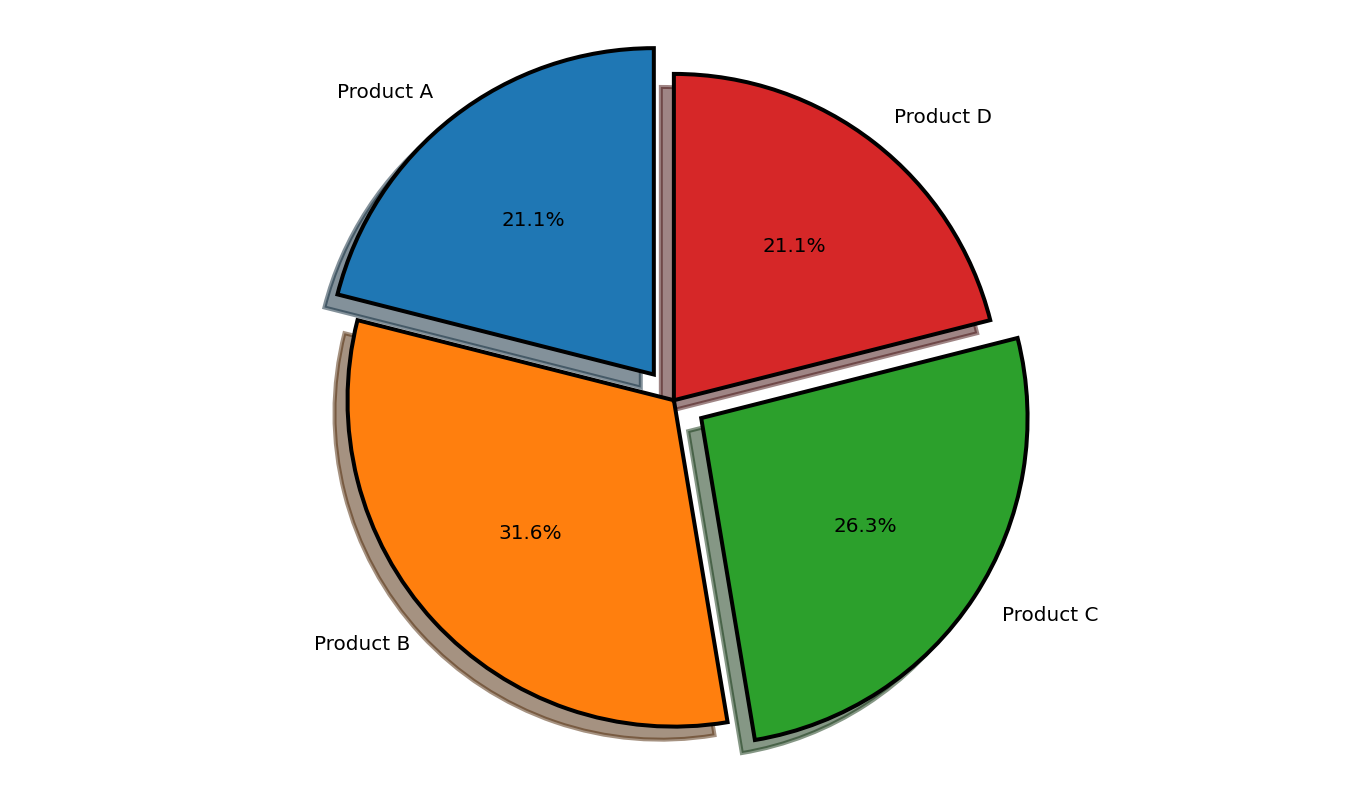
在此示例中,导入了 matplotlib.pyplot 模块。销售额和利润数组被初始化。定义了爆炸元组。必须拆分的切片的索引被赋予一个大于 0 的值。将切片移动到元组中指定的距离圆心的距离。饼图是针对指定数据绘制的。 autopct 属性用于指定切片中文本与圆心的距离。 startangle 用于指定图表的方向。 startangle 的默认值为 0,这意味着绘图从正 X 轴开始。边缘颜色设置为黑色,线宽设置为 2。抗锯齿属性设置为 true 以防止图像出现锯齿效果。
下面是实现:
蟒蛇3
import matplotlib.pyplot as plt

# the slices are ordered and plotted counter-clockwise:
sales = ['Product A', 'Product B',
         'Product C', 'Product D']

profit = [20, 30, 25, 20]
explode = (0.1, 0, 0.1, 0)

plt.pie(profit, explode = explode, labels = sales,
        autopct = '%1.1f%%',shadow = True,
        startangle = 90,
        wedgeprops = {"edgecolor":"black",
                    'linewidth': 2,
                    'antialiased': True})

# Equal aspect ratio ensures
# that pie is drawn as a circle.
plt.axis('equal')

plt.show()
输出: