📌 相关文章
- JavaFX bubble-chart(1)
- JavaFX bubble-chart
- 将 Pandas 交叉表转换为 Stacked DataFrame(1)
- 将 Pandas 交叉表转换为 Stacked DataFrame
- react chart.js - Javascript (1)
- HTML area标签(1)
- HTML area标签
- HTML<area>标签(1)
- HTML<area>标签
- react chart.js - Javascript 代码示例
- Semantic-UI Stacked Segments 组
- Semantic-UI Stacked Segments 组(1)
- JavaFX |弧与示例
- JavaFX |弧与示例(1)
- HTML |<area>类型属性(1)
- HTML |<area>类型属性
- chart.js cdn - Javascript (1)
- chart.js src - Javascript (1)
- D3.js area() 方法
- D3.js area.x() 方法
- D3.js area() 方法(1)
- D3.js area.x() 方法(1)
- HTML |<area>下载属性(1)
- HTML |<area>下载属性
- chart.js cdn - Javascript 代码示例
- chart.js src - Javascript 代码示例
- linux cli chart - Shell-Bash (1)
- 打印 vue-chart.js - Javascript (1)
- chart.js npm install - Javascript (1)
📜 JavaFX stacked-area-chart
📅 最后修改于: 2020-10-14 07:23:12 🧑 作者: Mango
JavaFX StackedAreaChart
堆叠面积图是基本面积图的扩展,其中在同一图形上显示几组值的演变。绘制了某个组的所有数据点的面积。但是,不同组的区域以堆栈的形式显示,但它们彼此不重叠。堆积面积图主要用于跟踪两组值之间的比较。
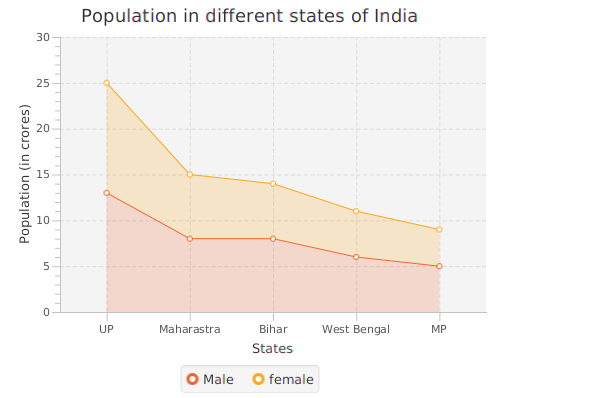
在下图中,显示了不同州的人口。男性和女性人口由两个不同的区域表示,其中代表女性人口的区域被绘制在代表女性人口的区域上。在X轴上,绘制了一些状态,而在Y轴上,绘制了人口(以千为单位)。
在JavaFX中,类javafx.scene.chart.StackedAreaChart用于表示堆积面积图。我们需要实例化此类以生成Stacked-Area-Chart节点。
物产
该类仅包含一个属性,该属性及其下表中的setter方法进行了描述。
| Property | Description | Setter Method |
|---|---|---|
| createSymbols | It is a boolean type property. Its true value indicates that the CSS symbols will get created for any of the data items for which the symbols are not created yet. | setCreateSymbols(boolean value) |
建设者
该类中有两个构造函数。
- 公共StackedAreaChart(Axis
X轴,轴 使用指定的轴创建StackedAreaChart的新实例。Yaxis): - 公共StackedAreaChart(Axis
X轴,轴 使用指定的轴和数据创建StackedAreaChart的新实例。Yaxis,ObservableList
例
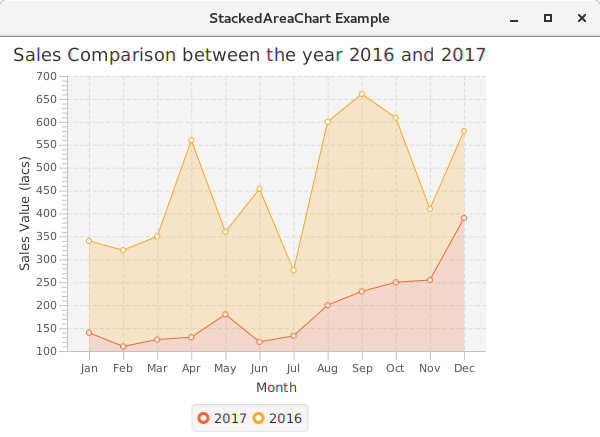
在以下示例中,我们显示了公司在两个不同年份的销售额之间的比较。
package application;
import javafx.application.Application;
import javafx.scene.Group;
import javafx.scene.Scene;
import javafx.scene.chart.CategoryAxis;
import javafx.scene.chart.NumberAxis;
import javafx.scene.chart.StackedAreaChart;
import javafx.scene.chart.XYChart;
import javafx.stage.Stage;
public class StackedAreaChartExample extends Application{
@Override
public void start(Stage primaryStage) throws Exception {
// TODO Auto-generated method stub
// Configuring Xaxis and Yaxis
CategoryAxis xaxis = new CategoryAxis();
NumberAxis yaxis = new NumberAxis(100,700,50);
xaxis.setLabel("Month");
yaxis.setLabel("Sales Value (lacs)");

//Creating StackedAreaChart
StackedAreaChart stack = new StackedAreaChart(xaxis,yaxis);
stack.setTitle("Sales Comparison between the year 2016 and 2017");

//Configuring Series 1
XYChart.Series year1 = new XYChart.Series<>();
year1.getData().add(new XYChart.Data("Jan",140));
year1.getData().add(new XYChart.Data("Feb",110));
year1.getData().add(new XYChart.Data("Mar",125));
year1.getData().add(new XYChart.Data("Apr",130));
year1.getData().add(new XYChart.Data("May",180));
year1.getData().add(new XYChart.Data("Jun",120));
year1.getData().add(new XYChart.Data("Jul",133));
year1.getData().add(new XYChart.Data("Aug",200));
year1.getData().add(new XYChart.Data("Sep",230));
year1.getData().add(new XYChart.Data("Oct",250));
year1.getData().add(new XYChart.Data("Nov",255));
year1.getData().add(new XYChart.Data("Dec",390));

//adding series1 to the stackedareachart
stack.getData().add(year1);
year1.setName("2017");

//Configuring Series 2
XYChart.Series year2 = new XYChart.Series<>();
year2.getData().add(new XYChart.Data("Jan",200));
year2.getData().add(new XYChart.Data("Feb",210));
year2.getData().add(new XYChart.Data("Mar",225));
year2.getData().add(new XYChart.Data("Apr",430));
year2.getData().add(new XYChart.Data("May",180));
year2.getData().add(new XYChart.Data("Jun",334));
year2.getData().add(new XYChart.Data("Jul",143));
year2.getData().add(new XYChart.Data("Aug",400));
year2.getData().add(new XYChart.Data("Sep",431));
year2.getData().add(new XYChart.Data("Oct",359));
year2.getData().add(new XYChart.Data("Nov",155));
year2.getData().add(new XYChart.Data("Dec",190));

//Adding Series2 to the StackedAreaChart
stack.getData().add(year2);
year2.setName("2016");


//Configuring group and Scene
Group root = new Group();
root.getChildren().add(stack);
Scene scene = new Scene(root,600,400);
primaryStage.setScene(scene);
primaryStage.setTitle("StackedAreaChart Example");
primaryStage.show();

}
public static void main(String[] args) {
launch(args);
}}