将绘图导出到 R 中的 EPS 文件
EPS 文件是以Encapsulated PostScript (EPS)文件格式保存的图形文件。 EPS 文件可能包含图像、图形甚至文本。在本文中,我们将讨论如何使用 R 编程语言将绘图导出到 EPS 文件。
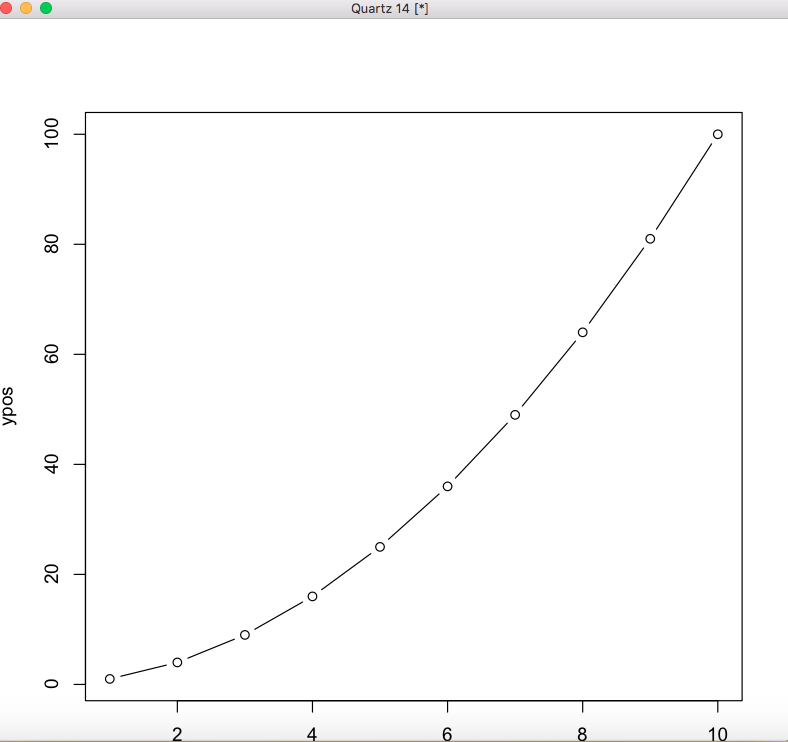
方法 1:使用 setEPS() 方法
可以使用 R 中的 setEPS() 方法定义 postscript。 postscript 启动图形设备驱动程序以生成 PostScript 图形。默认情况下,eps 文件存储在当前工作目录中。要将其保存到特定位置,请在 postscript()函数中指定完整的目标路径以及文件名。
例子:
R
# declaring the xpos vector
xpos <- c(1:10)

# declaring the ypos vector
# equivalent to x^2
ypos <- xpos^2

setEPS()

# naming the eps file
postscript("gfg.eps")

# plotting the x and y position
# vectors
plot(xpos,ypos)
dev.off()
R
# loading the required libraries
library("ggplot2")

# declaring the xpos vector
xpos <- 1:10

# declaring the ypos vector equivalent
# to x^2
ypos <- xpos^2

# declaring the data using x and y
# position vectors
data_frame <- data.frame(x = xpos,
                   y = ypos)
# plotting the data
ggplot(data_frame, aes(x, y)) + geom_point()

# save the eps plot
ggplot.save("gfg.eps")
输出
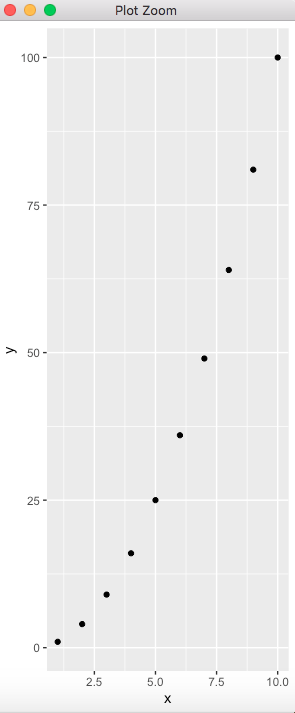
方法二:使用ggplot2
ggplot 库可以安装并加载到工作空间中以进行图形处理。该包中的 ggplot() 方法用于以散点图、箱线图和时间序列图的形式可视化数据。该方法以数据点的形式输入数据,然后显示散点图。在此函数中,通过选择变量 x 和 y 来部署美学映射(aes),并通过使用图中的 geom_point() 方法以点的形式添加数据的图形表示来进一步定制。可以使用 ggplot.save() 方法将绘图保存为 eps 格式,该方法将绘图的字符串名称作为参数。
例子:
电阻
# loading the required libraries
library("ggplot2")

# declaring the xpos vector
xpos <- 1:10

# declaring the ypos vector equivalent
# to x^2
ypos <- xpos^2

# declaring the data using x and y
# position vectors
data_frame <- data.frame(x = xpos,
                   y = ypos)
# plotting the data
ggplot(data_frame, aes(x, y)) + geom_point()

# save the eps plot
ggplot.save("gfg.eps")
输出