如何在Python中向图形添加多个轴
在本文中,我们将讨论如何使用 Python中的matplotlib 。我们将使用add_axes() matplotlib模块向图形添加多个轴的方法。
循序渐进的方法:
- 导入所需模块
- 导入matplotlib后,创建一个变量 fig 并将其等于plt.figure() 。这将创建一个空对象。它最初是空的,稍后将填充数据。
- 创建空对象后,我们将向该图形添加轴。由于我们要向该图中添加多个轴,因此需要使用函数add_axes() 向轴添加某些值,例如左、底部、宽度、高度。 add_axes()中 left、bottom、width 和 height 的值的范围是 0 到 1。
- 创建第一个轴后,添加第二个轴。与第 1 个轴相比,现在的值将更小,因为它将在较大的轴内制作。
- 在不绘制任何数据的情况下执行线条将提供具有多个轴且没有绘图的图形。
以下是基于上述逐步方法的一些程序:
示例 1:
下面的程序描述了如何将多个轴添加到绘图中。
Python3
# import matplotlib module
import matplotlib.pyplot as plt

# Creating an empty object
fig = plt.figure()

# Creation of multiple axes
# main axes
axes1 = fig.add_axes([0.1, 0.1, 0.9, 0.9])

# secondary axes
axes2 = fig.add_axes([0.2, 0.5, 0.5, 0.2])
Python3
# import matplotlib module
import matplotlib.pyplot as plt

# Creating object
fig = plt.figure()

# Creation of multiple axes
# using add_axes
axes1 = fig.add_axes([0.1, 0.1, 0.8, 0.8])
axes2 = fig.add_axes([0.2, 0.5, 0.2, 0.3])

# Creating the values
# of x and y for
# plotting graph
x = [1, 2, 3, 4, 5, 6, 7, 8, 9, 10]
y = [x**2 for x in x]

# plotting axes1
axes1.plot(x, y)

# Plotting axes2
axes2.plot(x, y)

# Showing the figure
fig.show()
Python3
# import matplotlib module
import matplotlib.pyplot as plt
# Creating an empty object
fig = plt.figure()

# Creation of multiple axes
# using add_axes
axes1 = fig.add_axes([0.1, 0.1, 0.8, 0.8])
axes2 = fig.add_axes([0.2, 0.5, 0.2, 0.2])

# Creating the values
# of x and y for
# plotting graph
x = [1, 2, 3, 4, 5, 6, 7, 8, 9]
y = [1, 2, 3, 4, 5, 6, 7, 8, 9]

# Plotting axes1
axes1.plot(x, y)

# Plotting axes2
axes2.plot(x, y)

# Showing the figure
fig.show()
输出:

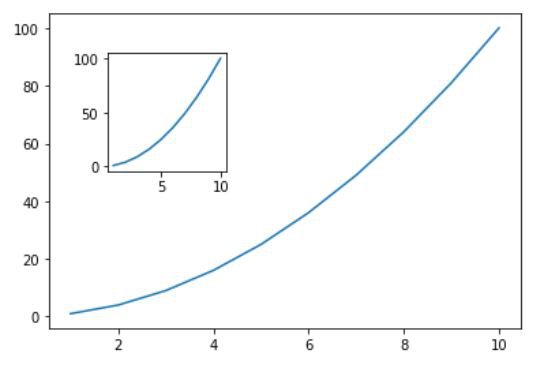
示例 2:
如果我们想将多个轴添加到带有绘制图形的图形中,那么我们需要添加下面演示的 x 和 y 的一些值,并在图形中绘制这些点。
蟒蛇3
# import matplotlib module
import matplotlib.pyplot as plt

# Creating object
fig = plt.figure()

# Creation of multiple axes
# using add_axes
axes1 = fig.add_axes([0.1, 0.1, 0.8, 0.8])
axes2 = fig.add_axes([0.2, 0.5, 0.2, 0.3])

# Creating the values
# of x and y for
# plotting graph
x = [1, 2, 3, 4, 5, 6, 7, 8, 9, 10]
y = [x**2 for x in x]

# plotting axes1
axes1.plot(x, y)

# Plotting axes2
axes2.plot(x, y)

# Showing the figure
fig.show()
输出:
示例 3:
蟒蛇3
# import matplotlib module
import matplotlib.pyplot as plt
# Creating an empty object
fig = plt.figure()

# Creation of multiple axes
# using add_axes
axes1 = fig.add_axes([0.1, 0.1, 0.8, 0.8])
axes2 = fig.add_axes([0.2, 0.5, 0.2, 0.2])

# Creating the values
# of x and y for
# plotting graph
x = [1, 2, 3, 4, 5, 6, 7, 8, 9]
y = [1, 2, 3, 4, 5, 6, 7, 8, 9]

# Plotting axes1
axes1.plot(x, y)

# Plotting axes2
axes2.plot(x, y)

# Showing the figure
fig.show()
输出:
